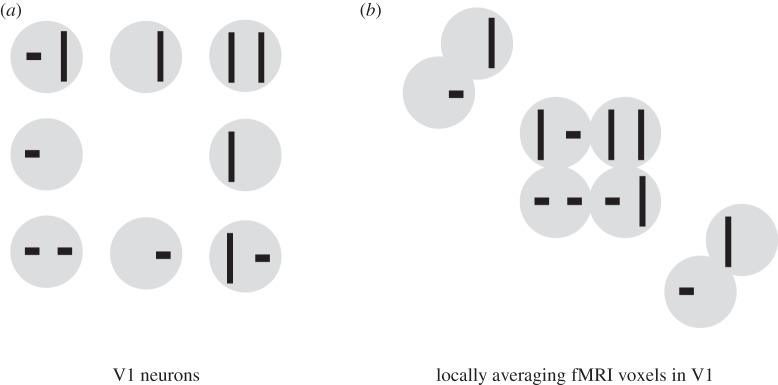
Figure 3.
Distortion of the apparent representational geometry by locally averaging voxels. This figure illustrates a worst-case scenario of how sampling with locally averaging fMRI voxels might distort the apparent representational dissimilarities. A set of eight stimuli (grey discs with black symbols) is presented to a primate one by one, all at the same retinal location. In the V1 representation (a), bars of opposite orientation (horizontal, vertical) in the same location (left half of the disc, right half of the disc) drive separate sets of neurons. Bars in different locations within the disc also drive separate sets of neurons. (a) The stimuli arranged in 2D, such that their distances on the page reflect their V1 representational dissimilarities. The stimulus pairs that are most distinct are stimulus pairs with opposite orientations in both locations (opposed corners). When the V1 representation is sampled with locally averaging fMRI voxels (b), neurons preferring opposite orientations in a single location are pooled and the orientation information is attenuated (though probably not lost altogether, cf. [44,49]). We therefore expect two stimuli with bars in the same locations to elicit similar fMRI patterns, irrespective of the bars' orientation. As a result, the stimulus pairs that are most similar in the fMRI voxels are those that are most distinct in the neurons. The V1-neuron RDM is expected to be negatively correlated with the V1-voxel RDM. These observations hold for this particular stimulus set, not in general. The arrangements drawn here are approximate and designed to ensure visibility of all stimuli. (Qualitatively similar results obtain with MDS using Euclidean, cosine or city block distance to measure representational dissimilarity and various MDS cost functions including metric stress, stress and strain).

