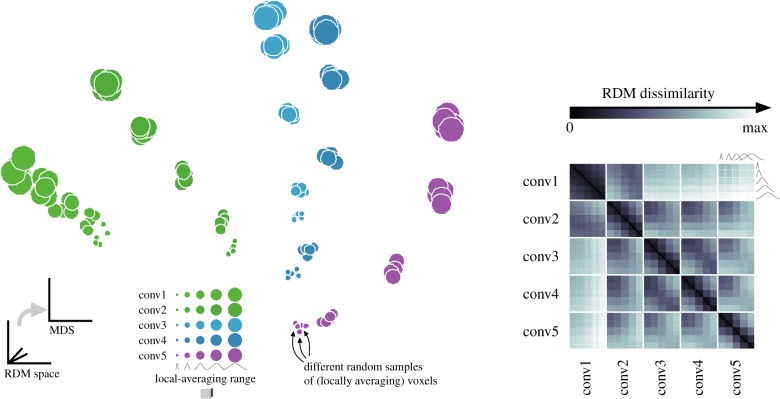
Figure 5.
RDMs are robust to random sampling of locally averaging measurement channels, but strongly reflect the brain-computational model and the range of local averaging in measurement. MDS (left) was used to visualize the pairwise differences among the RDMs (matrix of Euclidean distances between RDMs on the right). Each point corresponds to an RDM. The MDS arrangement is optimized for the 2D distances between points to best represent (in the sense of least squared deviations) the differences between RDMs. For clarity, the set of RDMs was restricted to five different local-averaging ranges (circle size). RDMs shown are for the no-noise condition, where random variability results only from the random sampling of 500 simulated voxels among the population of measurement channels. Clusters of overlapping points correspond to sets of five RDMs resulting from repeated sampling of the representation with a fresh set of 500 voxels placed at random locations in the BCM's representation. The difference between two RDMs was measured by the Euclidean distance between their dissimilarities. The MDS arrangement minimizes the metric stress criterion.

