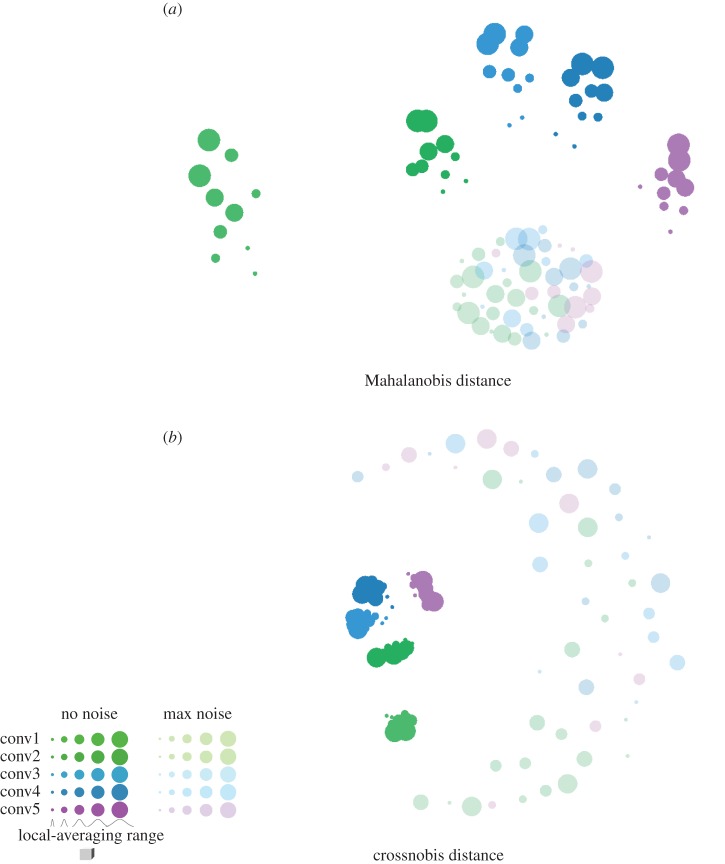
Figure 6.
Noise mixes the RDM distributions associated with different BCMs. For each BCM (conv1–5) and each MM (local-averaging kernel widths indicated by circle size), RDMs for two different noise levels are shown in MDS arrangements. In the no-noise condition, the only source of random variability in the RDMs is the random sampling of 500 locally averaging measurement channels. No noise is added to the channel responses. In the maximal noise condition, the amount of noise added is the upper limit of the noise levels used in simulating the single-subject data. Noise is differently reflected in Mahalanobis distance RDMs (a) and crossnobis distance RDMs (b). Noise nonlinearly distorts data-based Mahalonobis distances in comparison to the Mahalanobis distances among the true patterns. Noise creates a positive bias, which is strong for short distances and weak for long distances. High noise flattens Mahalanobis RDMs and makes them converge on a point in RDM space where all pairwise distances are equal and long. The crossnobis distance estimator, by contrast, is unbiased. Its expected values match the Mahalanobis distances among the true patterns. High noise, then, pushes RDMs in random directions and can mix the RDM distributions associated with different BCMs in the periphery. Conventions as in figure 5. MDS based on Euclidean distances among RDMs, minimizing metric stress.

