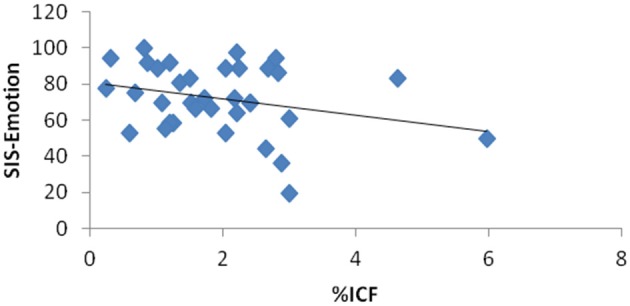
Figure 4.

Scatter plot graph for the relationship between SIS-Emotion and intracortical facilitation in the unlesioned hemisphere measured by TMS.

Scatter plot graph for the relationship between SIS-Emotion and intracortical facilitation in the unlesioned hemisphere measured by TMS.