
Fig. 1.
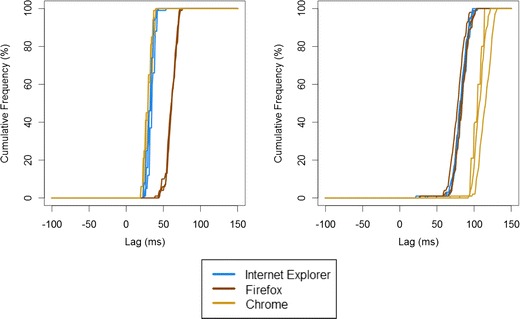
Cumulative frequency distribution of stimulus onset asynchronies (SOAs) in Study 1 across three browsers, showing test–retest consistency for three runs of 100 trials on the desktop PC. The left panel shows JavaScript performance, and the right panel shows Flash performance