
Figure 7.
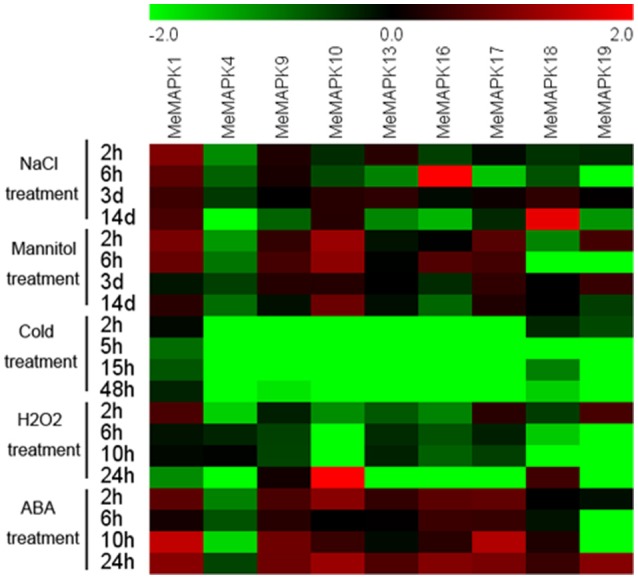
Expression patterns of MAPK genes in leaves of cassava in response to osmotic, salt, cold, oxidative stresses, and ABA. Log2 based value was used to create the heat map. The scale represents the relative signal intensity values.
Official websites use .gov
A
.gov website belongs to an official
government organization in the United States.
Secure .gov websites use HTTPS
A lock (
) or https:// means you've safely
connected to the .gov website. Share sensitive
information only on official, secure websites.
Expression patterns of MAPK genes in leaves of cassava in response to osmotic, salt, cold, oxidative stresses, and ABA. Log2 based value was used to create the heat map. The scale represents the relative signal intensity values.