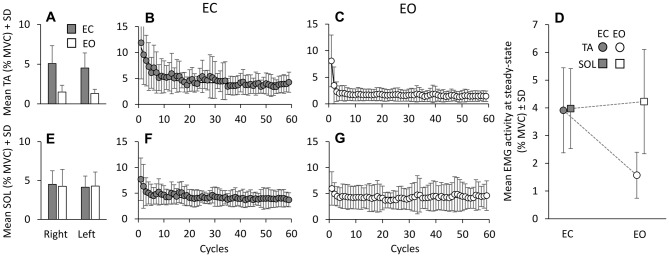
Figure 2.
Mean TA and Sol activity. Mean muscle activities, across cycles and subjects in EC (gray bars) and EO (white bars) conditions, are almost the same between legs, for TA (A) and Sol (E). The mean activity of TA (B,C) and Sol (F,G) are calculated for each platform cycle, EC and EO. With EC, both TA and Sol activities gradually decrease to steady state. The exponential functions fitted to the EC data are y = 4.15 + 6.77e−t/5.1 for TA and y = 4.09 + 2.87e−t/4.3 for Sol. With EO, both TA and Sol activities reach steady state very soon. The functions best fitting the mean muscle activities with EO are: y = 1.63 + 6.42e−t/0.8 for TA and y = 4.26 + 1.71e−t/0.97 for Sol. (D) shows that the mean Sol activity level at steady state is similar EC and EO, while TA is greatly reduced EO.

