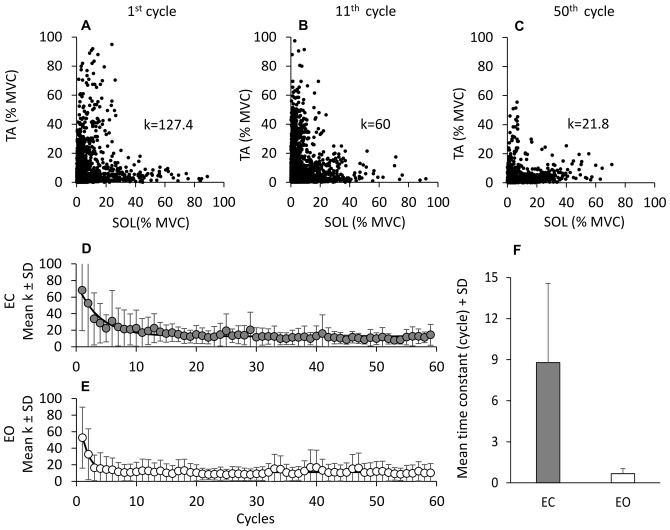
Figure 3.
Reciprocal activation of TA and Sol. In (A–C), TA activity is plotted against that of Sol for three non-consecutive cycles in one subject to show the progressive decrease in the co-activation pattern. The value of k (the TA and Sol co-contraction index) diminishes with cycle repetition. (D,E) show the grand means of k, obtained by averaging the k of each subject for each subsequent cycle, EC (D) and EO (E). The exponential functions fitted to the data points are y = 12.4 + 50.4e−t/4.2, EC; and y = 8.5 + 34.8e−t/1.2, EO. (F) show the mean time-constants obtained by fitting an exponential function to the data points of each subject and of each condition. The time-constant of the “co-activation” adaptations is much longer EC (gray bar) than EO (white bar).

