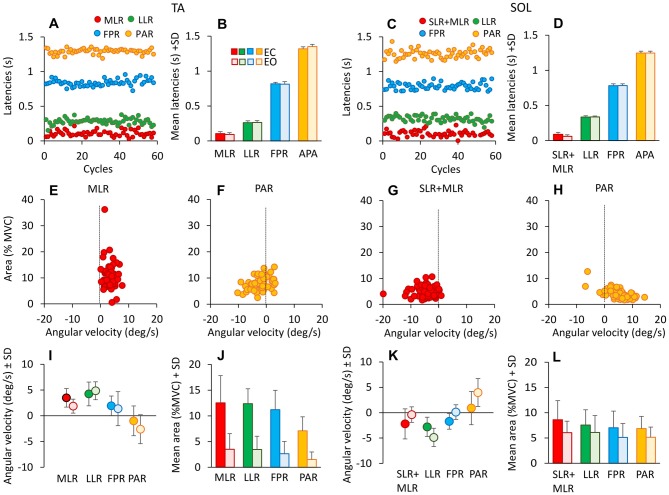
Figure 5.
Latencies of TA and Sol bursts. These are expressed with respect to the onset of platform forward movement (TA, left panels), and to the onset of backward movement for Sol (right panels). (A,C) show the onset latencies for TA and Sol bursts, in one subject cycle by cycle and for all response types (red medium-latency response (MLR) or SLR + MLR, green long-latency response (LLR), blue fall-preventing response (FPR) and yellow proactive response (PAR)). The grand means of the onset latencies of TA (B) and Sol (D) responses are reported. There are no differences in burst latencies between EC and EO, for both TA and Sol. (E–H) show TA (MLR, E; PAR, F) and Sol (SLR + MLR, G; PAR, H) burst areas against the corresponding ankle angular velocities for all cycles in one subject EC. TA and Sol reflex responses occur during muscle lengthening (positive ankle velocity for TA, negative for Sol), whereas PAR responses do not, for either TA or Sol. (I,K) show the grand means of ankle angular velocities preceding TA (I) and Sol (K) bursts EC and EO. Velocities are similar between EC and EO, but not across responses. (J,L) show the grand means of TA (J) and Sol (L) response area EC and EO. Bursts are smaller EO than EC for all responses. TA activity diminishes more than Sol activity passing from EC to EO.

