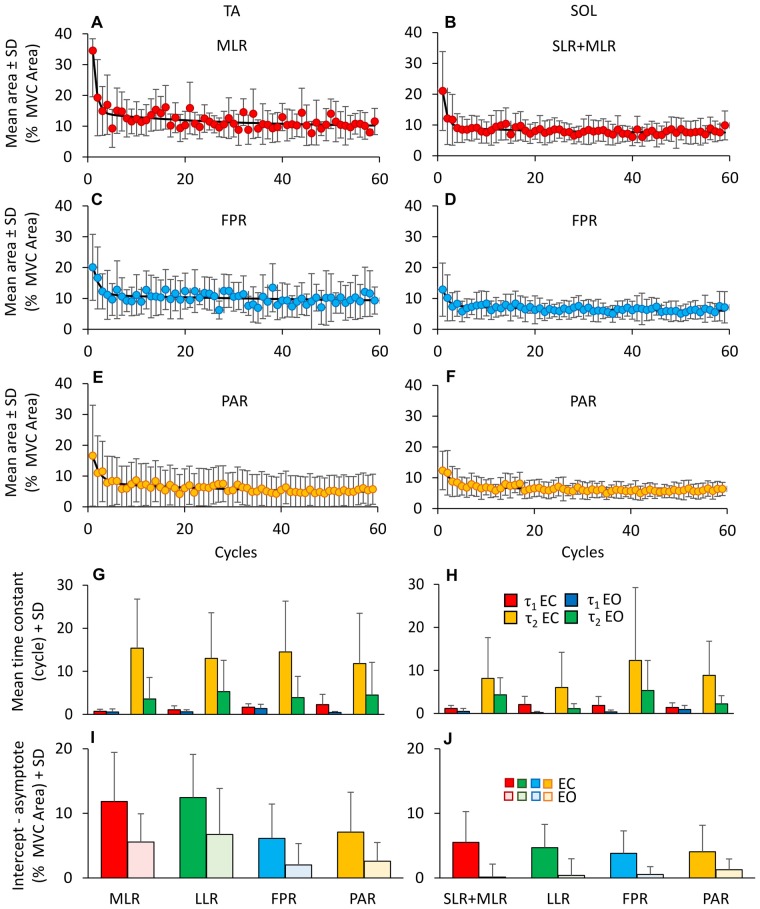
Figure 6.
Adaptation of reflex and anticipatory response. (A–F) Shows the adaptation of the different TA (MLR, A; FPR, C; PAR, E) and Sol responses (SLR + MLR, B; FPR, D; PAR, F). For TA, the exponential functions fitting the mean burst area are y = 9.7 + 20.3e−t/0.8 + 4.5e−t/26.8 for MLR, y = 8.3 + 9.4e−t/1.3 + 2.8e−t/62.6 for FPR and y = 4.3 + 8.5e−t/1.5 + 3.6e−t/32.1 for PAR. For Sol, the exponential functions are y = 7.46 + 11.5e−t/0.8 + 2e−t/17.1 for SLR + MLR, y = 5.7 + 5.4e−t/1.0 + 1.9e−t/29.8 for FPR and y = 5.5 + 5.2e−t/1.8 + 2e−t/22.4 for PAR. (G,H) show the mean time constants obtained by fitting with a double exponential function the TA (G) and Sol (H) responses EC (τ1, red bars; τ2, yellow bars) and EO (τ1, blue bars; τ2, green bars). The time constants differ between EC and EO and between TA and Sol. The extent of adaptation in the amplitude of the response bursts (I,J) is higher for TA than Sol, higher with EO than EC and different between reflex and anticipatory responses.

