Figure 8.
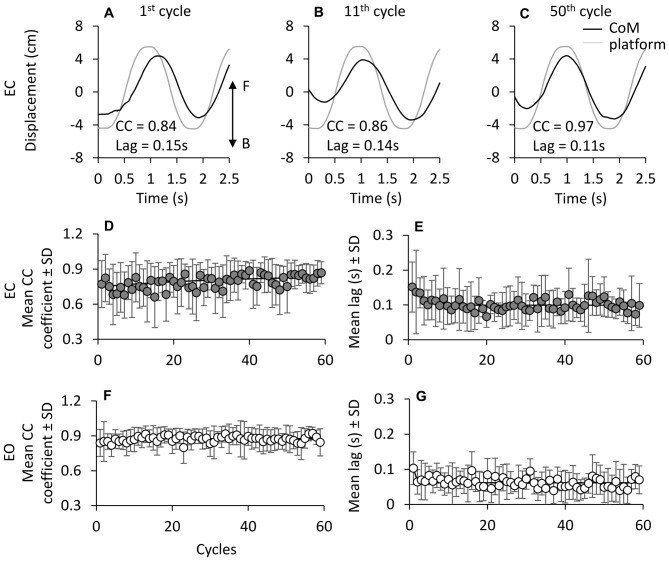
Cross correlation (CC) between CoM and platform displacement. (A–C) show CoM (black line) and platform displacement (gray line; both referred to the laboratory space) during three non-consecutive cycles in one subject EC (F, forward; B, backward). (D,E) show the grand mean of the CC coefficient at time lag = 0 between CoM and platform displacement traces. CC values slightly increase with cycle repetition under both EC (D) and EO (E) condition. The exponential functions fitted to the mean CC coefficient data points are y = 0.83 − 0.15e−t/36.3 in EC and y = 0.87 − 0.04e−t/4.7 in EO. At the beginning of the oscillation cycles, CoM follows the platform with a lag of about 0.16 s EC, and 0.1 s EO. The time lag between CoM and platform diminishes with cycle (F,G) both EC and EO. The exponential function is y = 0.10 + 0.05e−t/2.7 in EC and y = 0.06 + 0.04e−t/0.5 in EO.

