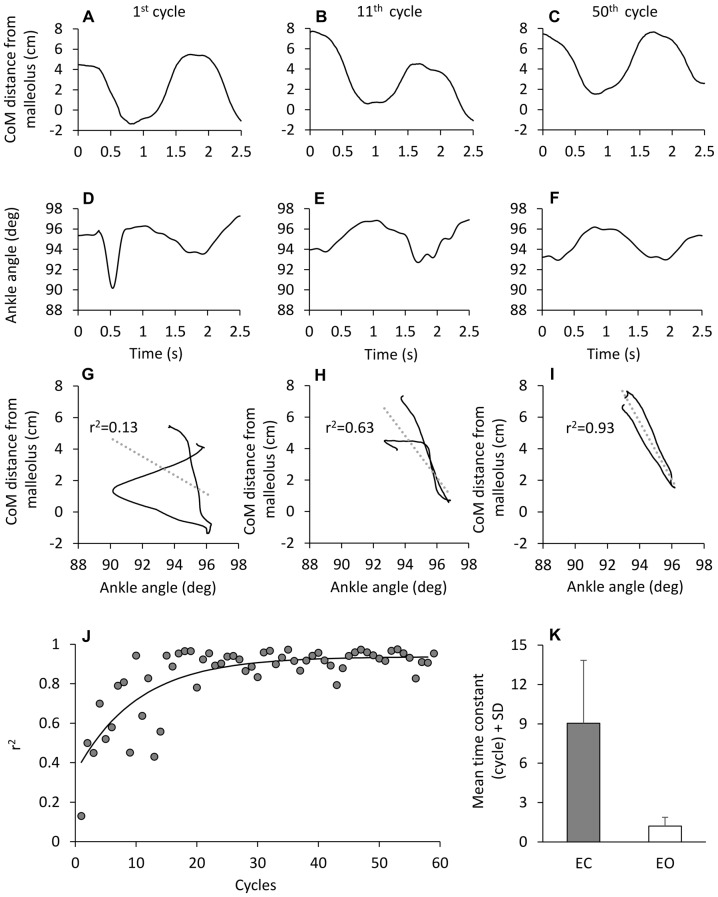
Figure 9.
Time-dependence of the correlation between CoM displacement and ankle angle variation. (A–F) CoM horizontal distance from malleolus (A–C) and ankle angle variation (D–F) in one subject during three different cycles of perturbation EC. When the CoM distance from malleolus is plotted against ankle angle (G–I), the association between the two traces improves with cycle number. (J) show the value of the determination coefficient (r2) calculated for each cycle EC. The r2 values increase with cycle repetition with a time-constant of 10.1 cycles (y = 0.93 + 0.6e−t/10.1). (K) show the mean time-constant across subjects, EC (gray bar) and EO (white bar).

