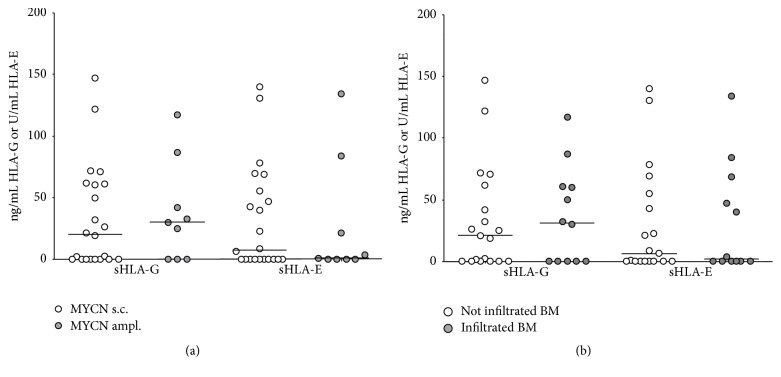
Figure 2.
Levels of soluble (s)HLA-G and sHLA-E in BM plasma samples have been analyzed in patients presenting (grey circles) or not (white circles) MYCN amplification (a) or BM infiltration (b). Horizontal lines indicated medians. Results are expressed as ng/ml (sHLA-G) or arbitrary units (U)/ml (sHLA-E).

