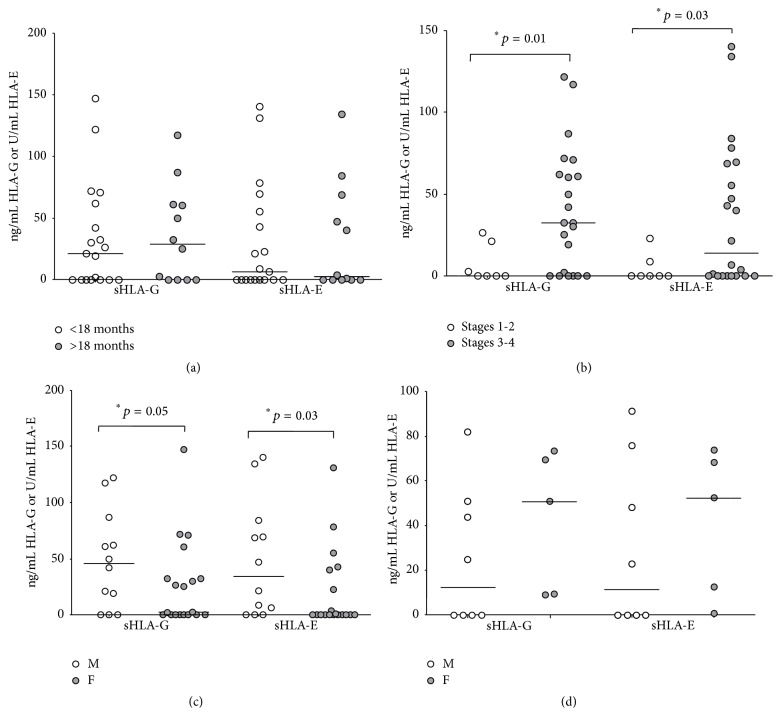
Figure 3.
Levels of soluble (s)HLA-G and sHLA-E in BM plasma samples have been analyzed in patients with age at diagnosis above (grey circles) or below (white circles) 18 months (a) and in patients with stages 3-4 (grey circles) or 1-2 (white circles) disease (b). Differences between female (grey circles) or male (white circles) subjects have been analyzed in NB patients (c) and healthy donors (d). Horizontal lines indicated medians. Results are expressed as ng/ml (sHLA-G) or arbitrary units (U)/ml (sHLA-E). p values are indicated where differences are statistically significant.

