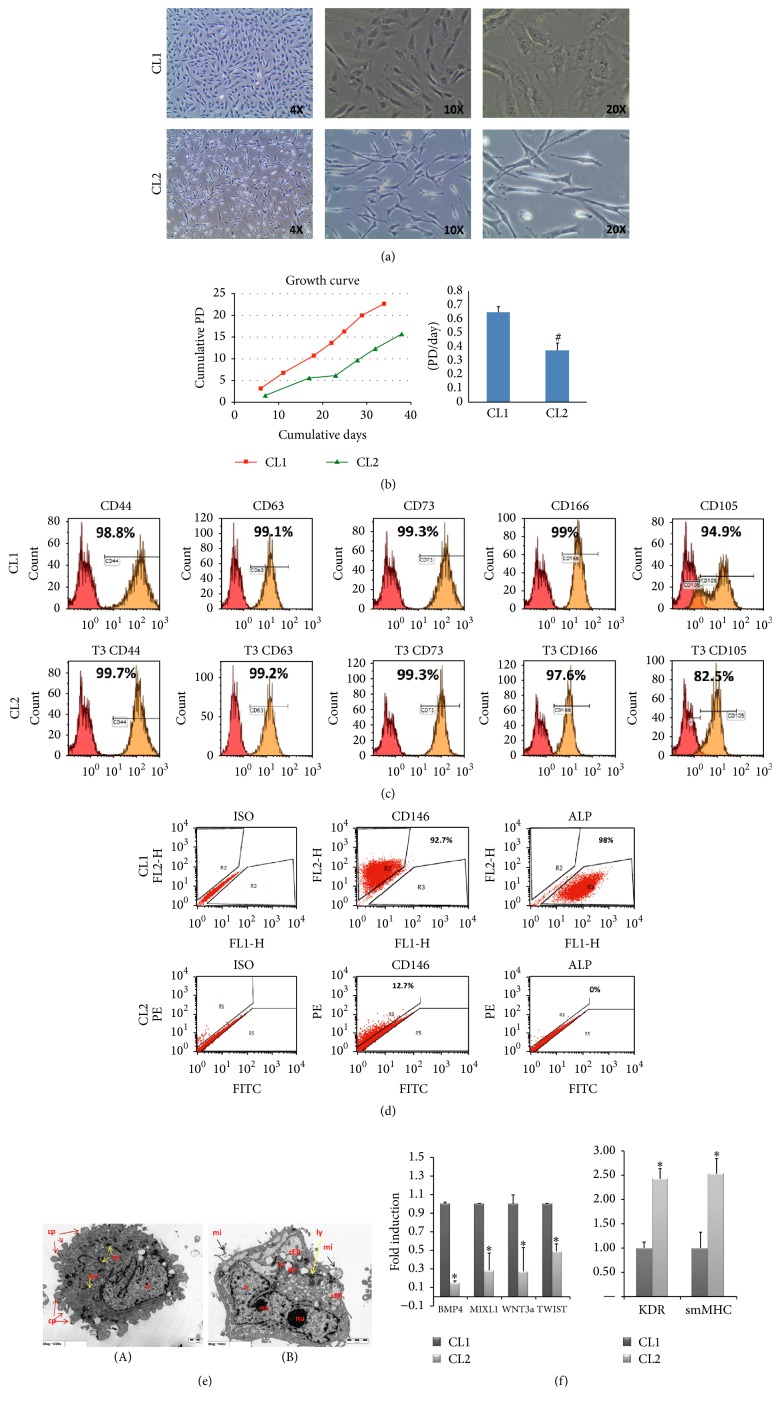
Figure 1.
Cellular phenotype of two clonal populations of human bone marrow stromal stem cells: CL1 and CL2. (a) Cell morphology. CL1 cells showed large cuboidal morphology while CL2 cells had spindle-shaped fibroblast-like morphology. (b) Growth curves showing population doubling (PD) rate during long term culture. (c) Flow cytometry analysis (FACS) shows expression of CD44, CD63, CD73, CD105, and CD166 in CL1 and CL2 cells. Matched isotype control was used for gating. (d) Flow cytometry analysis presented as dot blot of CD146 and alkaline phosphatase (ALP) cell surface proteins. (e) Transmission electron microscope (TEM). (A): CL1 (1200x); (B): CL2 (1500x). n: nucleus, nu: nucleolus, rER: rough endoplasmic reticulum, ly: lysosomes, pv: phagocytic vacuole, and rer: reticular stalk of rER. (f) Gene expression analysis using RT-PCR for a group of mesodermal and stromal genes. Gene expression was normalized to GAPDH and presented as fold change. Data is shown as mean ± SD of three independent experiments. ∗ p < 0.05; # p < 0.001.

