Figure 2.
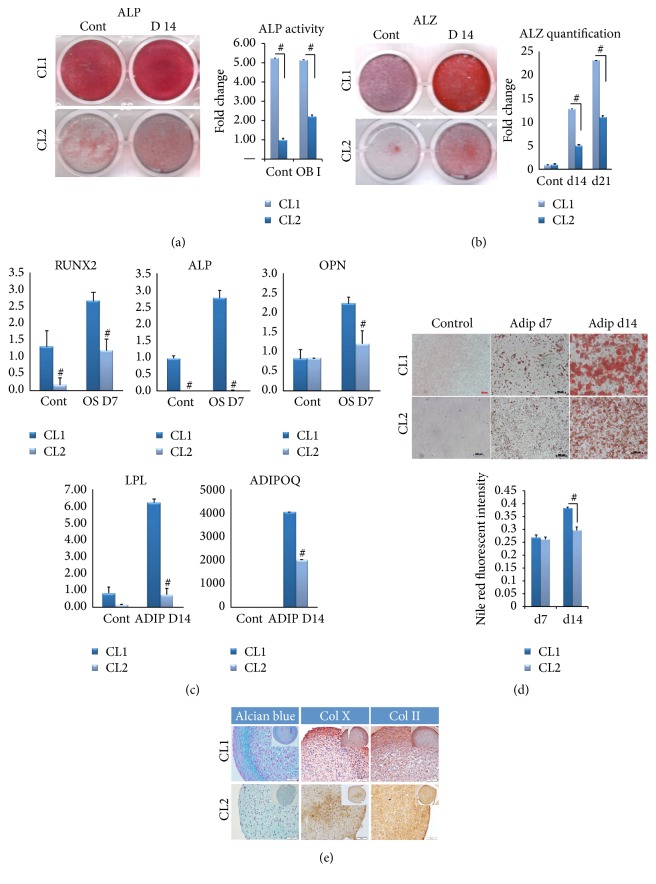
In vitro osteoblastic and adipocytic differentiation of two clonal populations of human bone marrow stromal stem cells: CL1 and CL2 cells. Both cell lines were induced for osteoblast differentiation using standard protocol described in the Methods. (a) ALP staining at day 14 in control noninduced (Cont) and osteoblast induced cells (D14). Right panel shows ALP activity (n = 3 independent experiments, # p < 0.001). (b) Mineralized matrix formation visualized by Alizarin Red S staining. Right panel shows Alizarin Red quantification at day 14 and 21 after osteoblast differentiation (n = 3 independent experiments, # p < 0.001). (c) Quantitative RT-PCR of osteoblastic and adipocyte gene markers in CL1 and CL2 during osteoblast (upper panel) and adipocyte (lower panel) differentiation. ALP = alkaline phosphatase, OPN = osteopontin, LPL = lipoprotein lipase, and ADIPOQ = adiponectin. Data are presented as fold change in expression of each target gene normalized to GAPDH (n = 3 independent experiments, p < 0.05; # p < 0.001). (d) CL1 and CL2 lines were induced for adipocyte differentiation using standard protocol described in the Methods. Adipocyte formation was visualized at day 7 (Adip d7) and day 14 (Adip d14) by Oil Red-O staining. Lower panel presents quantification of Nile red staining (n = 3 independent experiments, # p < 0.001). (e) CL1 and CL2 lines were induced for chondrocyte differentiation using 21-day pellet culture method as described in the Methods. The pellets were stained with Alcian blue, collagen 10 (Col X), and collagen 2 (Col II) (original magnification 5x).

