Figure 3.

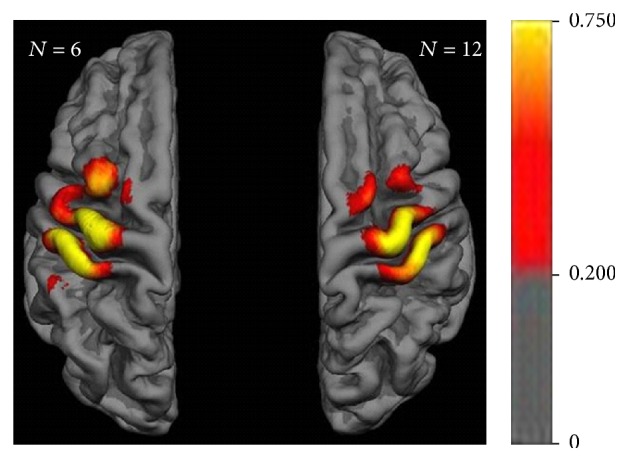
Motor map group data of individual means over time with mean overlap percentage. Color bar indicates percent of subjects presenting with MEPs > 50 μV throughout the experimental sessions.

Motor map group data of individual means over time with mean overlap percentage. Color bar indicates percent of subjects presenting with MEPs > 50 μV throughout the experimental sessions.