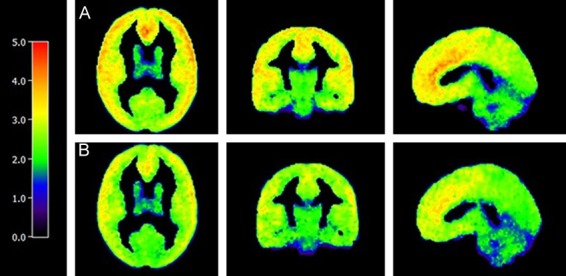
Figure 1.

Average Parametric V T Images for Male and Female Cohorts. Average parametric V T image of males (A, n=18) and females (B, n=9). V T at each voxel is calculated using MA1 (t*=30). Values outside of 3 standard deviations of the mean were excluded. Colored legend depicts [11C] LY2795050 V T from 0 (black) to 5.00 (red).
