
Figure 4.
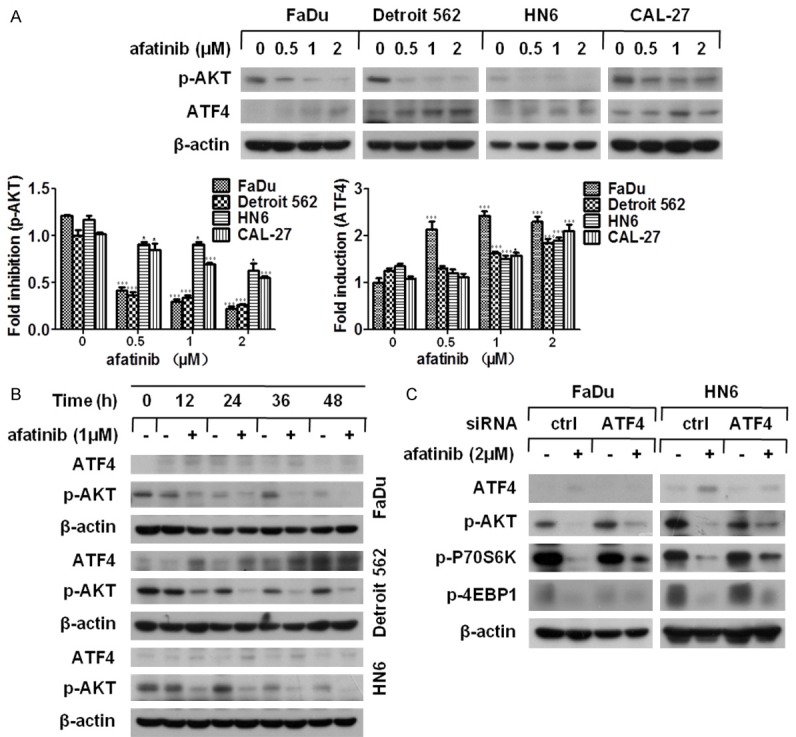
Afatinib suppresses AKT-mTOR via ATF4 up-regulation. (A) The indicated cell lines were treated with afatinib at various concentrations for 24 h. Thereafter, the whole cell lysates were harvested and prepared for Western blot analysis. The given proteins were quantified by Image J software, bars S.D. *P<0.05, **P<0.01 as compared with control (B) FaDu, Detroit 562 and HN6 cells were treated with 1 μM afatinib for various lengths of time. Then, the whole cell lysates were harvested and prepared for Western blot analysis. (C) FaDu and HN6 cells were seeded in 6-well plates and transfected with ATF4 siRNA on the second day. Forty-eight hours later, cells were cultured with 2 μM afatinib for 24 h. Then, cells were collected for Western blot analysis.