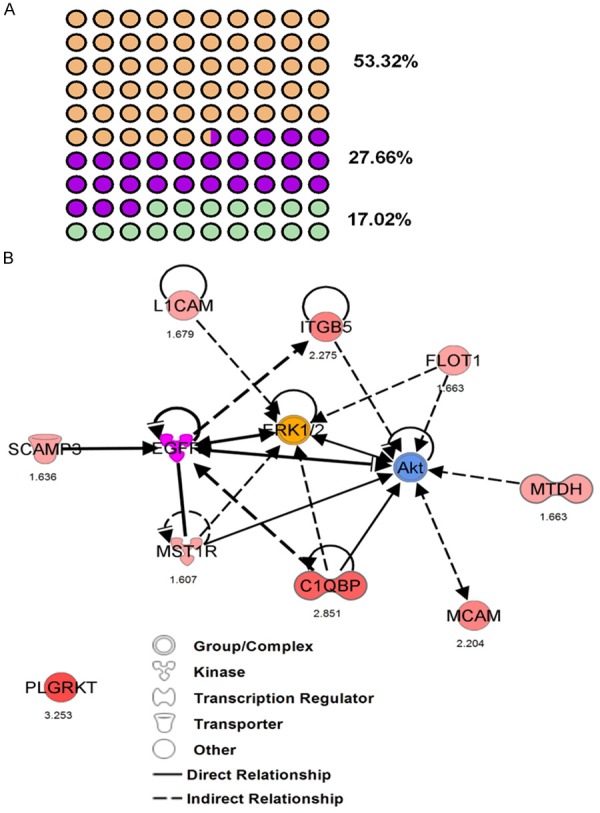
Figure 3.

Functional network analysis of differentially upregulated PMPs. A. Top network functions identified as upregulated proteins in IBC cells. Network 1: Cell Morphology, Cellular Assembly and Organization, Immunological Disease (orange dots). Network 2: Hereditary Disorder, Cellular Assembly, Organization, Function, Maintenance (purple dots). Network 3: Gene Expression, RNA Damage and Repair, RNA Post-Transcriptional Modification (green dots). B. The image was created using the Ingenuity Pathways Analysis (IPA) platform (Ingenuity Systems; ©2000-2015 QIAGEN) by overlaying the PMPs detected by SILAC (red) onto a molecular network from the Ingenuity knowledgebase. Red indicates high SILAC ratios, and purple, yellow and blue indicates proteins that were not identified by SILAC but form part of this network. For each identified protein, the number corresponds to the protein quantification (log2 ratio). Legend indicates the function of each protein and the interactions between them.
