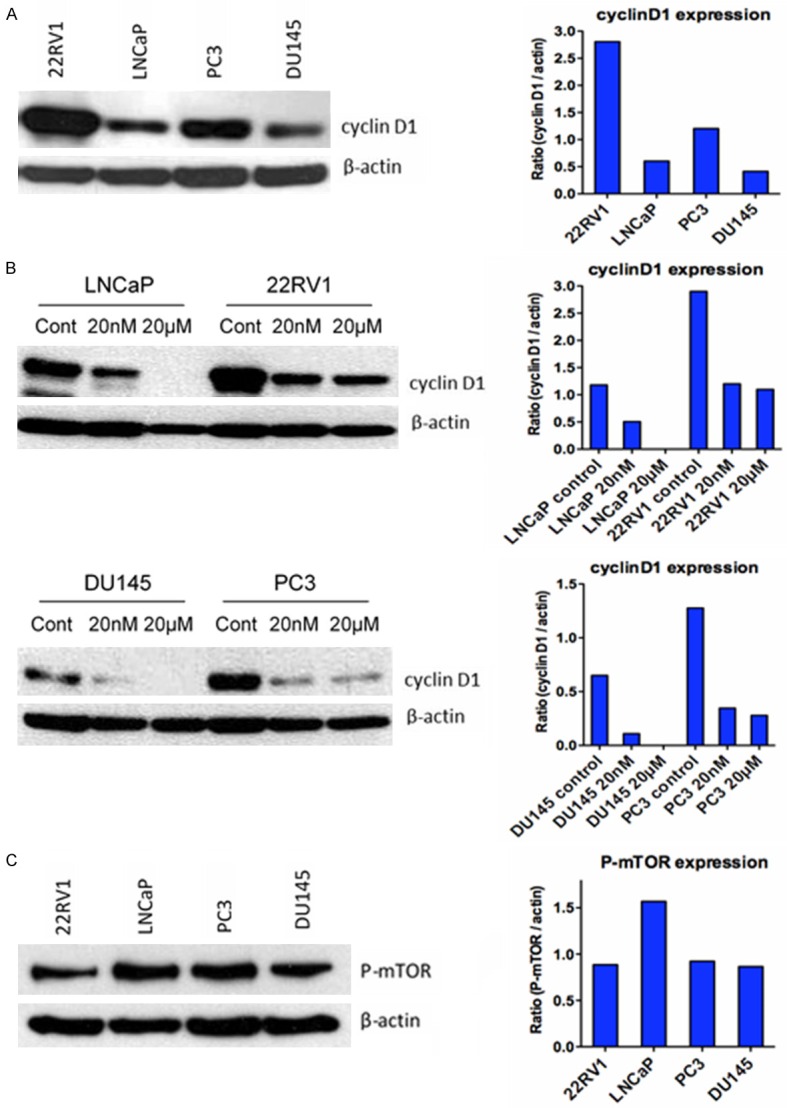
Figure 3.

Western blot analysis of cyclin D1 and p-mTOR protein levels in prostate cancer cells pre- and/or post-rapamycin treatment. A. Base-line expression levels of cyclin D1 in prostate cancer cell lines; B. Cyclin D1 protein levels after rapamycin treatment; and C. Base-line expression levels of p-mTOR in those prostate cancer cell lines.
