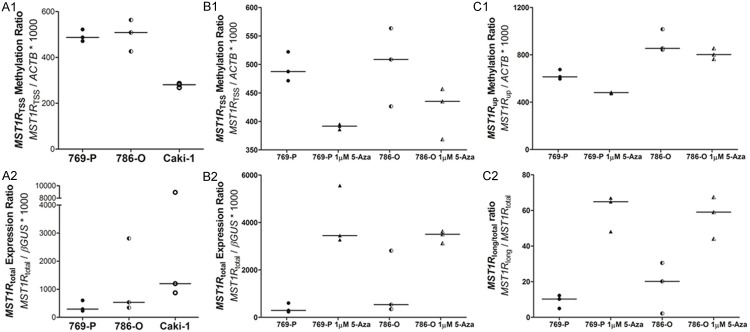
Figure 3.
MST1R methylation and expression levels in ccRCC cell lines. A: MST1R TSS methylation level (A1) and MST1R total expression level (A2) in three cell lines. B: MST1R TSS methylation level (B1) and MST1R total expression level (B2) in 769-P and 786-O cell lines before and after demethylating treatment with 1 µM 5-aza-2’deoxycytidine for 72 h. C. MST1R up methylation level (C1) and MST1R long/total ratio (C2) in 769-P and 786-O cell lines before and after demethylating treatment with 1 µM 5-aza-2’deoxycytidine for 72 h.

