Figure 1.

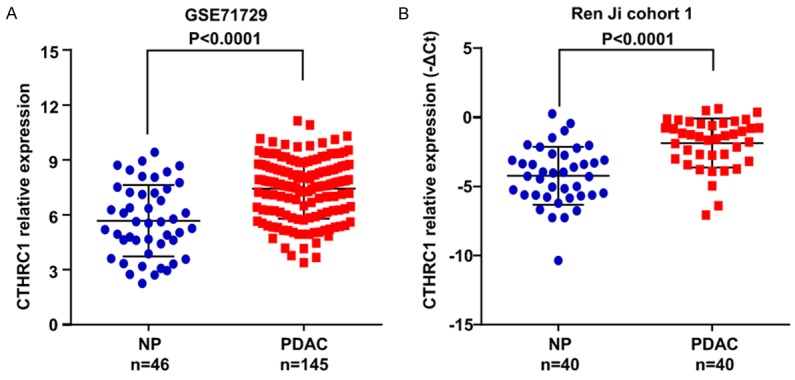
CTHRC1 expression in PDAC at mRNA level. A. CTHRC1 expression in GSE71729 derived from GEO grouped by normal pancreas (NP, n=46) and PDAC (n=145). P-values were calculated using the Mann-Whitney test. B. Increased CTHRC1 mRNA expression in 40 pairs of PDAC/normal pancreas (NP) was detected by real-time PCR (paired t-test). Error bars in the scatter plots represent SD.
