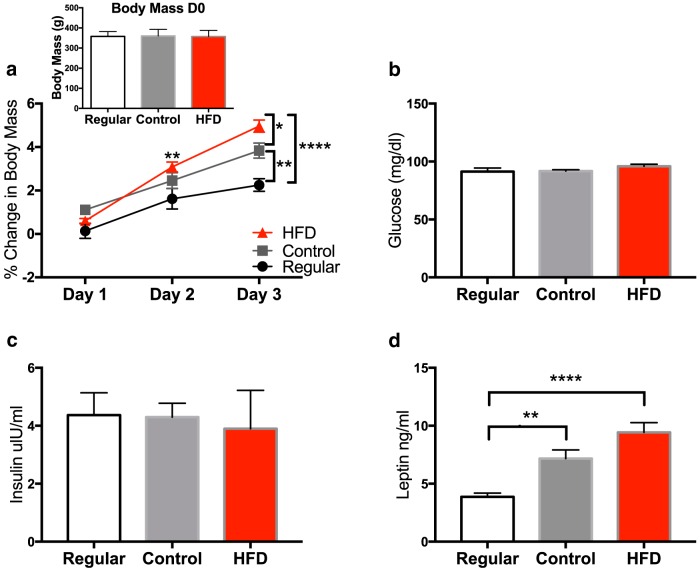
Figure 1.
Body mass and metabolic changes. a, Daily percentage change in body mass over the 3 d in which rats had free access to the regular chow diet, control diet, and the HFD. Inset, Body weights on day 0 of rats assigned to the three groups. b–d, Levels of whole-blood glucose (b), plasma insulin (c), and plasma leptin (d) in rats fed a regular chow diet, a control diet, and an HFD. Data are reported as the mean ± SEM. *p < 0.05; **p < 0.01; ***p < 0.001; ****p < 0.0001.

