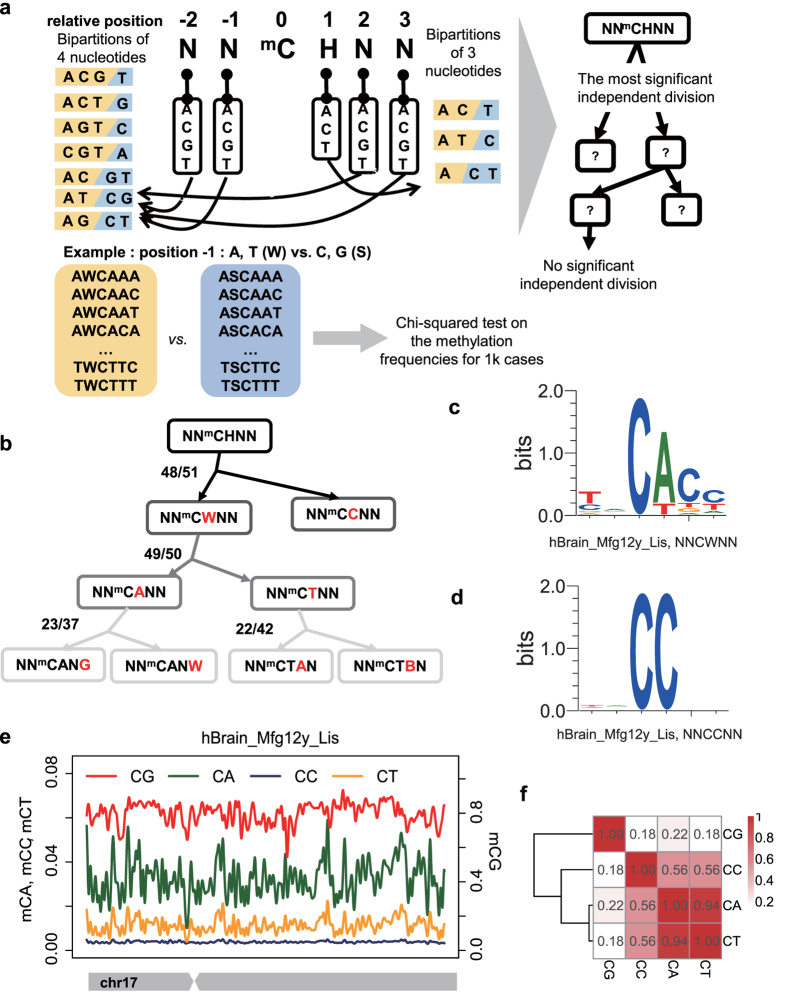
Figure 1. CW and CC are the major independent non-CG contexts.
(a) Schematic of the MiDD (minimum dependence decomposition) method. Enumeration of all bipartitions at each base of the 6-mer (NNmCHNN) was conducted and the most significantly independent bipartition for at least half of the samples was adopted. The selection processes were performed for each sub-context recurrently until no significant bipartition was found. (b) The hierarchical motif tree of mCH built by MiDD. The numbers “n/m” beside the branches indicate that m samples report significant bipartition and that n samples report the represented division as the most significant bipartition. The red nucleotide indicates the position for bipartition. W = {A, T}. B = {C, G, T}. (c,d) The normalized logo plots for mCW (c) and mCC (d) in the sample hBrain_Mfg12y_Lis. (e) An example showing the methylation level profiles in four contexts (CA, CC, CG and CT) across chromosome 17. Lines are smoothed based on the average methylation levels in bins. Bin size, 20 k bp. (f) Heatmap showing the spatial correlation coefficients of the methylation levels among the four contexts (CA, CC, CG and CT) as in (e). Number in each cell, Pearson’s r. Distance is defined as (1−r2) for hierarchical clustering.

