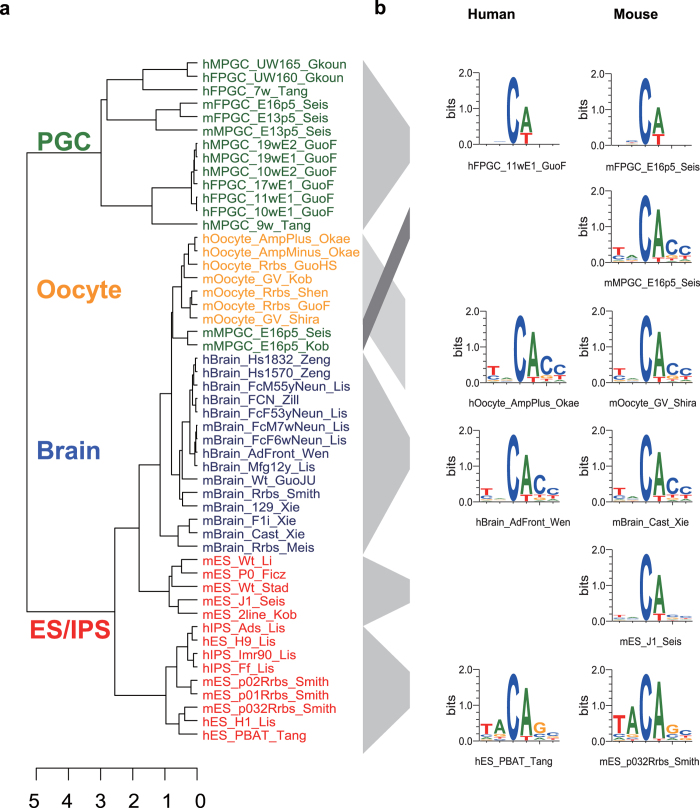
Figure 2. Comparison of the sequence preferences of mCW.
(a) Unsupervised hierarchical clustering based on the ranking of the average methylation levels of 6-mers (NNmCWNN). Colours indicate cell types. Distance is defined as (1−ρ2), where ρ is Spearman’s correlation coefficient, measuring the similarity of the sequence preferences based on the bulk methylation levels of 6-mers for each sample pair. Clustering method, complete. (b) Logo plots of the normalized mCW motifs.

