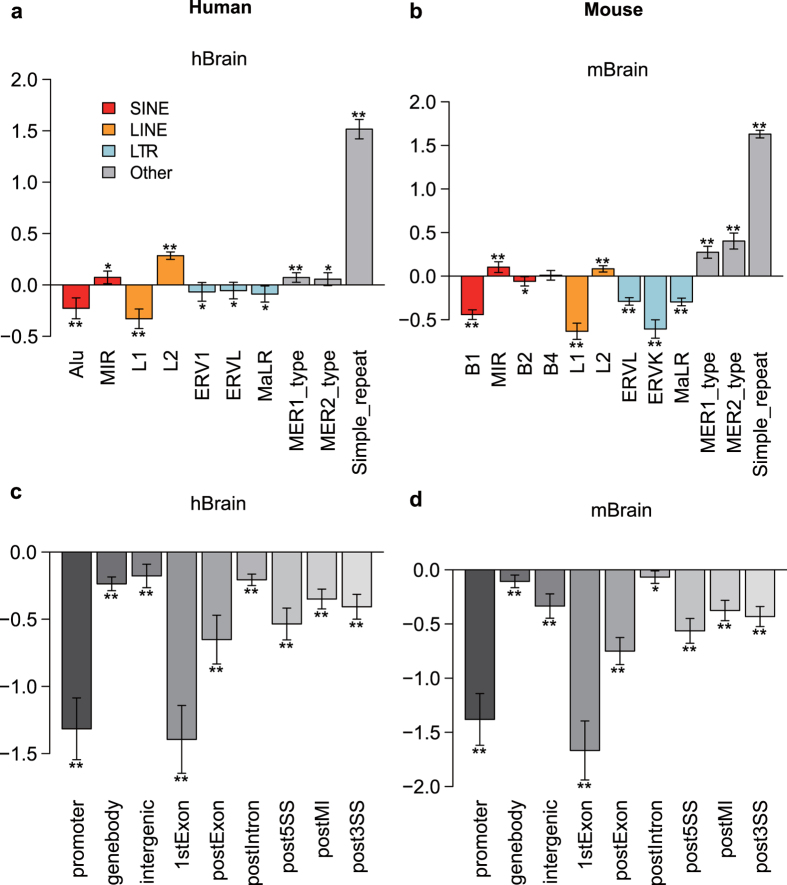
Figure 3. Enrichments of brain neuron mCW in genomic regions are consistent between humans and mice.
Enrichment studies of the recurrent brain mCW sites in multiple samples in humans (a,c) and mice (b,d). The repeat elements investigated include SINEs, LINEs, LTRs and others (a,b). The gene related regions are separated as the promoter, gene body, intergenic regions, first exon (1stExon) and posterior exons (postExon), introns (postIntron), 5′ splicing site region (post5SS), middle intron (postMI) and 3′ splicing site region (post3SS). Y-axis, enrichment score, defined as the log2 fold changes between observed high mCW site count and expected high mCW site count. The mean (bar height), s.d. (error bar), and p-values (by two tailed t test; *p < 0.01; **p < 1e-6) are calculated based on the enrichment scores in all autosomes.

