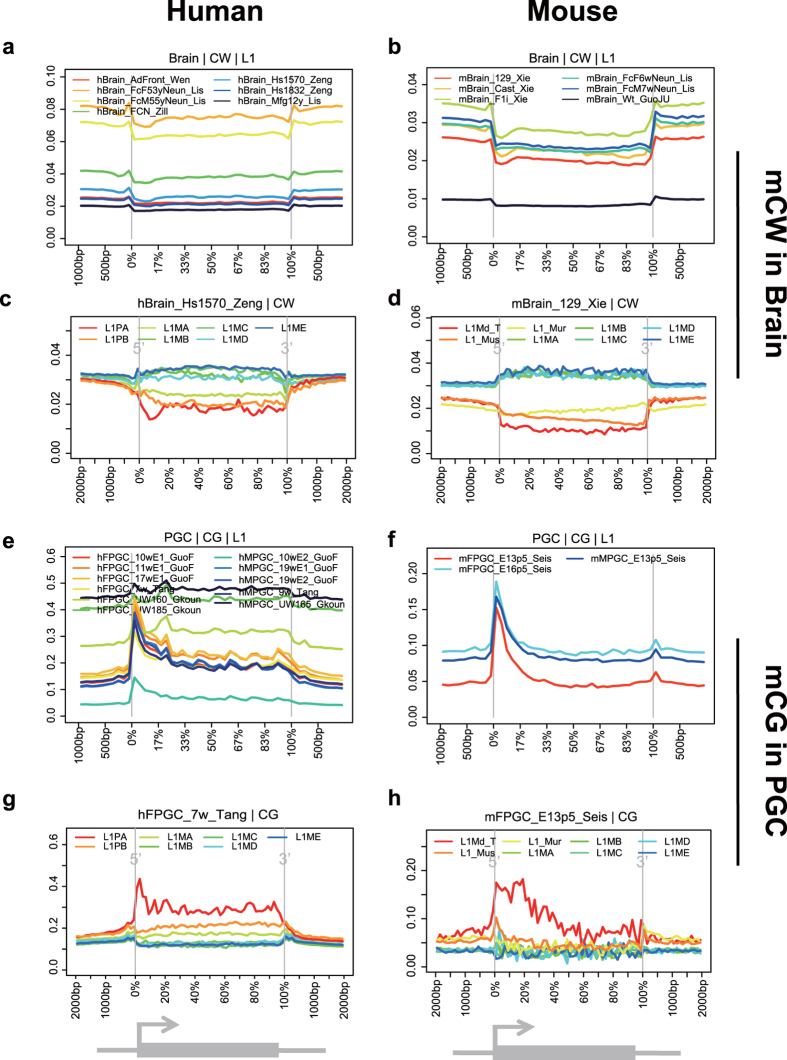
Figure 4. Young LINE-1 elements prefer lower mCW in brain and higher mCG at promoters in PGCs.
Profiles of brain mCW across LINE-1 elements in humans (a) and mice (b). Examples of mCW profiles across subtypes of LINE-1 elements, including L1PA (youngest), L1PB, L1MA, L1MB, L1MC, L1MD, and L1ME (most ancient) in humans (c) and L1Md_T (youngest), L1_Mus, L1_Mur, L1MA, L1MB, L1MC, L1MD, and L1ME (most ancient) in mice (d), showing that young LINE-1 elements prefer lower mCW. Profiles of PGC mCG across LINE-1 elements in humans (e) and mice (f). Examples of mCG profiles across subtypes of LINE-1, from young to ancient in humans (g) and mice (h), showing that young LINE-1 elements prefer higher mCG at promoters.

