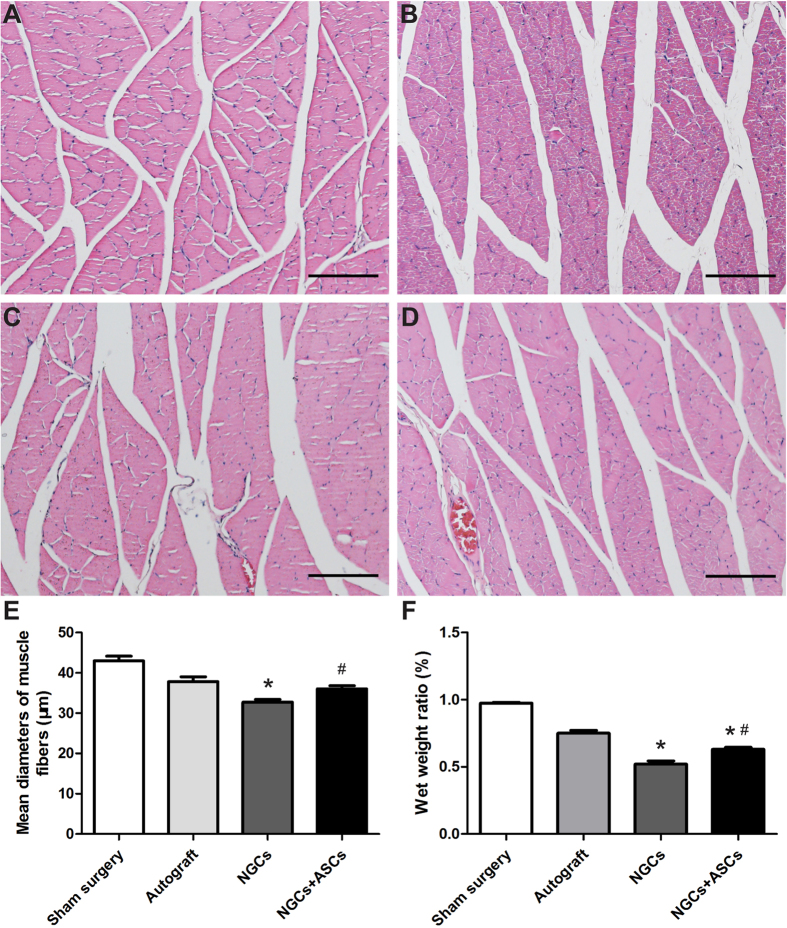
Figure 9. The gastrocnemius muscles atrophy and re-innervation.
(A–D) H&E staining of gastrocnemius muscles cross-section in the sham surgery (A), autograft (B), NGCs (C), and NGCs + ASCs (D), groups at 16 weeks after implantation (Scale bars = 100 μm). (E) The mean diameters of muscle fibers and (F) the wet weight of the operated side to the non-operated side in different groups (n = 4). ∗p < 0.05 for comparison with autograft group, and #p < 0.05 for comparison with NGCs group.

