Figure 11.

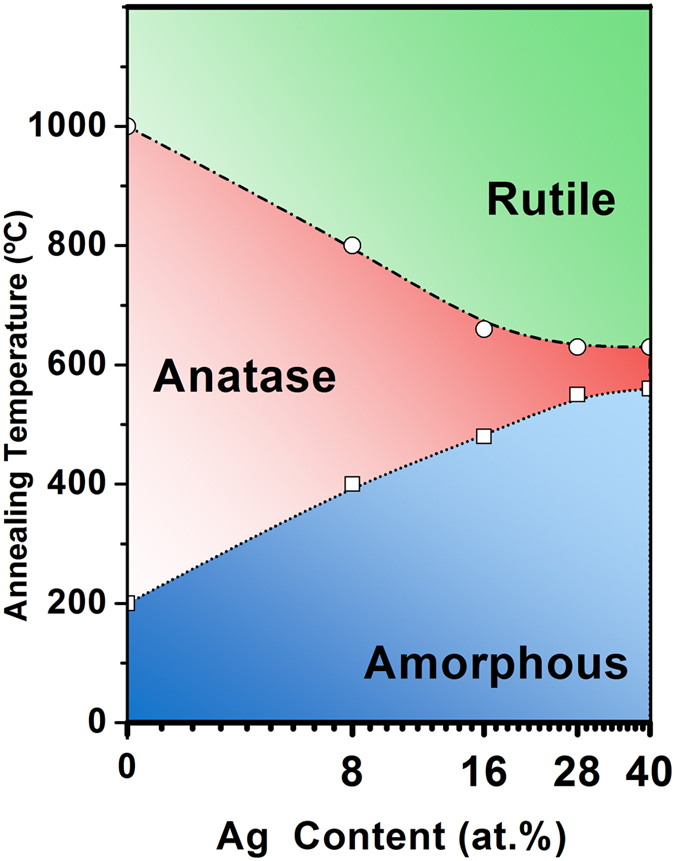
Phase diagram of the Ag-TiO2 films with different silver content expressed in atomic percent Ag:(Ti + Ag). The phase diagram was obtained based on both Raman and XRD data.

Phase diagram of the Ag-TiO2 films with different silver content expressed in atomic percent Ag:(Ti + Ag). The phase diagram was obtained based on both Raman and XRD data.