
Figure 11.
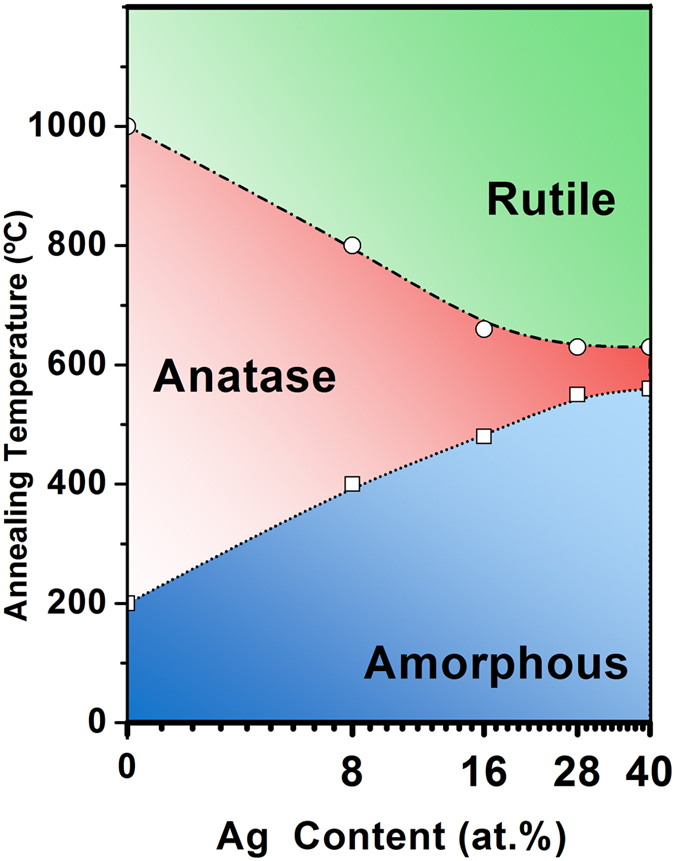
Phase diagram of the Ag-TiO2 films with different silver content expressed in atomic percent Ag:(Ti + Ag). The phase diagram was obtained based on both Raman and XRD data.
Official websites use .gov
A
.gov website belongs to an official
government organization in the United States.
Secure .gov websites use HTTPS
A lock (
) or https:// means you've safely
connected to the .gov website. Share sensitive
information only on official, secure websites.
Phase diagram of the Ag-TiO2 films with different silver content expressed in atomic percent Ag:(Ti + Ag). The phase diagram was obtained based on both Raman and XRD data.