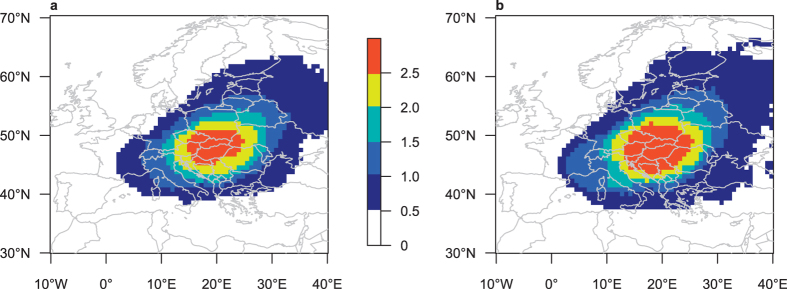
Figure 4. Heavy precipitation causing cyclones.
Track density of cyclones that pass through the study region (15–22°E, 46–51°N; red box in Fig. 2) on days where daily precipitation aggregated over that area exceeds the 95th percentile of all summer days in the respective experiment. Counts of cyclone centres that pass within 500 km of a grid point. Unit: Cyclones per summer (JJA). (a) Track density in control; (b) Track density in Medwarm. Maps created with R version 3.2.3 (www.r-project.org).

