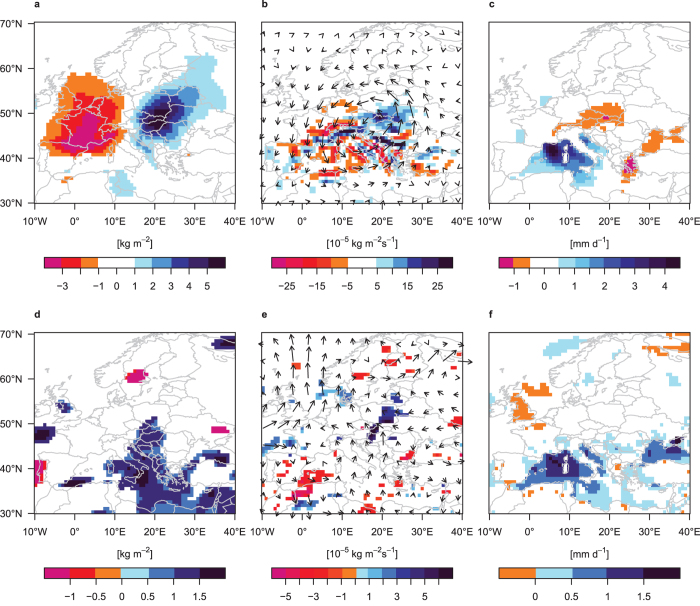
Figure 5. Variables related to the hydrometeorological cycle during heavy-precipitation events.
Heavy-precipitation events are days where daily precipitation aggregated over the study region (15–22°E, 46–51°N; red box in Fig. 2) exceeds the 95th percentile of all summer days in the respective experiment. (a–c) Composite anomalies in control experiment (relative to climatology) and (d–f) significant differences (based on a two-sided independent samples t-test at the 90% significance level) between composites in Medwarm and control: (a,d) Column integrated precipitable water (kg m−2); (b,e) vertically integrated moisture convergence (10−5 kg m−2 s−1) and vertically integrated moisture transport as vectors (every fifth vector is plotted), vector length is (b) 50 kg m−1 s−1 per degree lon/lat and (e) 10 kg m−1 s−1 per degree lon/lat; (c,f) evaporation (mm d−1). Maps created with R version 3.2.3 (www.r-project.org).

