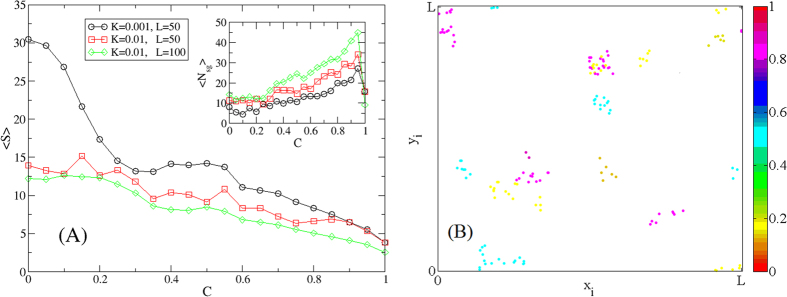
Figure 4. Effects of confirmation bias.
(A) Average group size 〈S〉 (main), and number of stable groups 〈Nsg〉 (inset), as a function of the parameter C tuning the strength of the bias, for different values of the social influence strength K and collision probability pc = πd2ρ. tuned by varying the box size L. (B) Sketch of the metapopulation structure obtained for C = 0.6 (for a full video, see Movie S3). The other parameters are fixed as in Fig. 2(b). Note the presence of groups formed by agents with very different opinions.

