Figure 9.

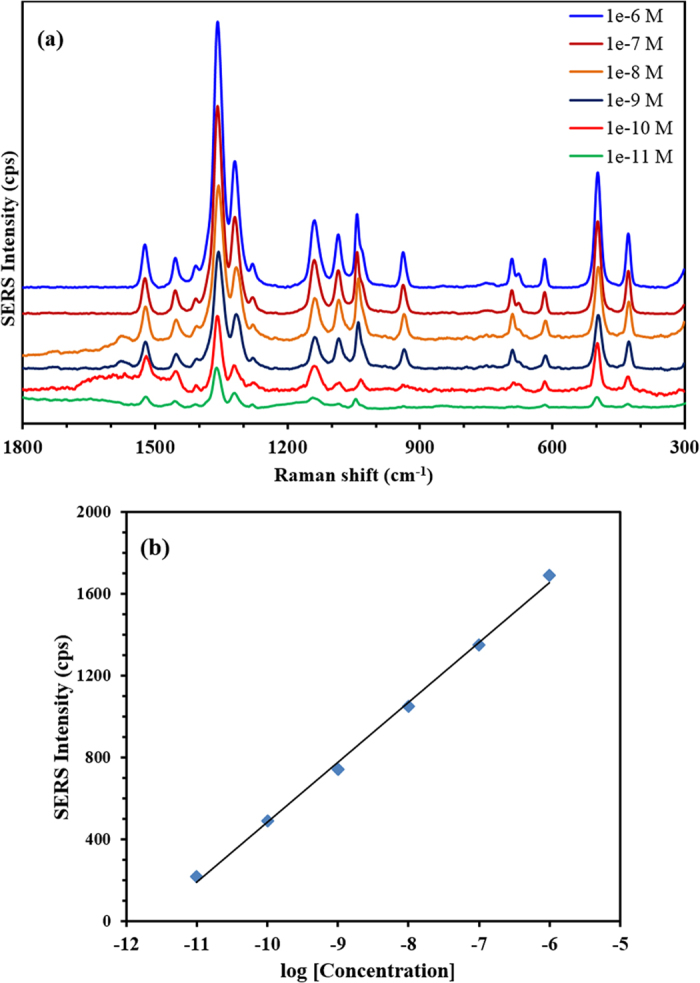
(a) SERS spectra of MTZ with different concentration using G-D-Ag, (b) calibration curve of the band at 1359 cm−1. Laser ʎ = 633 nm, acquisition time; 20 sec, and objective; 50x.

(a) SERS spectra of MTZ with different concentration using G-D-Ag, (b) calibration curve of the band at 1359 cm−1. Laser ʎ = 633 nm, acquisition time; 20 sec, and objective; 50x.