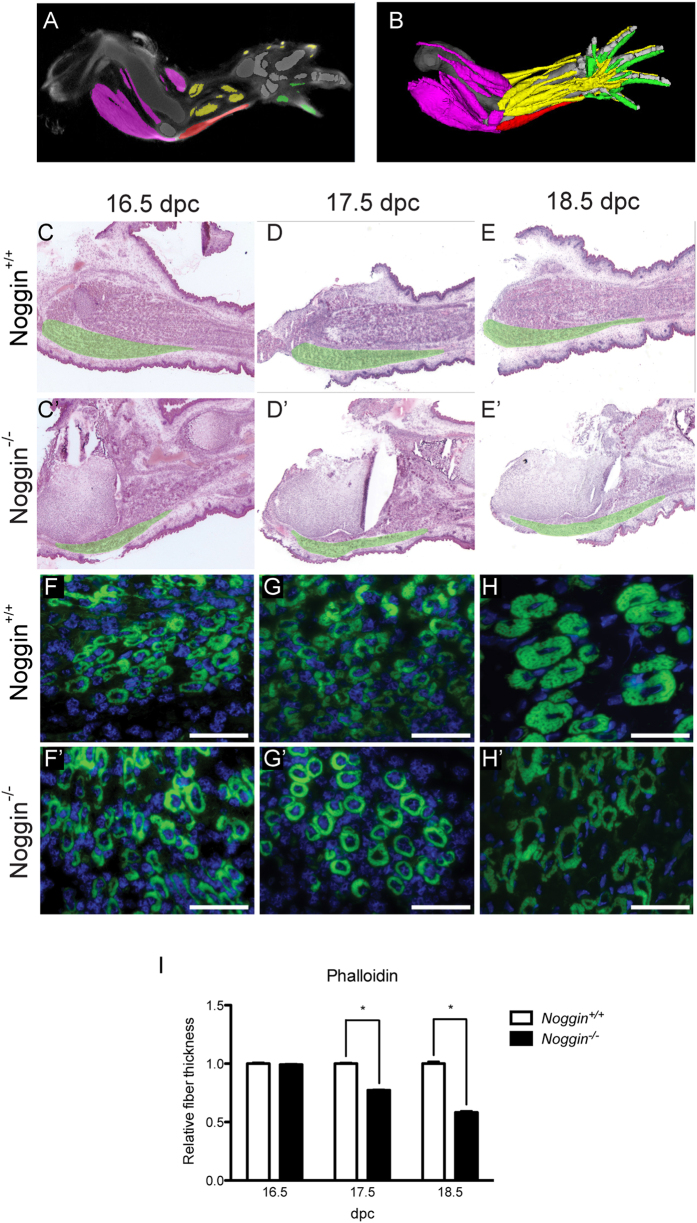
Figure 1. Analysis of the muscle fiber thickness.
(A,B) The limb at 15–16 dpc using Jatlasviewer. The musculus flexor carpi ulnaris is colored in red. (C–E’) H&E staining on sagittal sections of the limbs at the indicated stages and genotype. The musculus flexor carpi ulnaris is digitally indicated in green. (F–H’) Actin immunofluorescence on cross-sections of muscles at the indicated stages. (I) Quantification using ImageJ of the thickness of the fiber. Values plotted as mean ± sem; over 100 fibers of at least 3 different mice embryos were analyzed per condition; *p < 0.05

