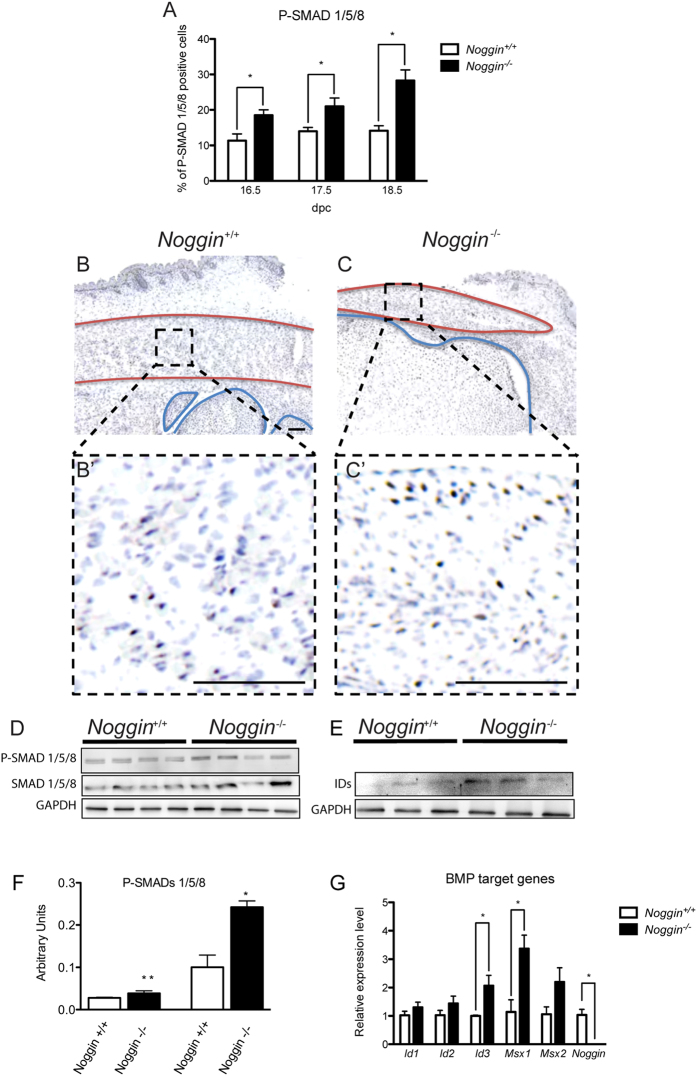
Figure 2. Analysis of the BMP signaling pathway.
(A) Quantification of P-SMAD1/5/8 immunohistochemistry on sagittal sections of musculus flexor carpi ulnaris of Noggin+/+ and Noggin−/− mice at the three different stages investigated. Values plotted as mean ± SEM; n = 5; *p < 0.05. Representative immunohistochemistry for P-SMAD1/5/8 at 16.5 dpc in Noggin+/+ (B) and Noggin−/− muscle (C). Enlargement of muscle area delineated in black in B’ and C’. Muscle is delineated in red, cartilage and bone in blue. Scale bar: 100 μm. (D) WB analysis of the levels of P-SMAD1/5/8 compared to total SMAD1/5/8 and (E) IDs, normalized for GAPDH. (F) Quantification of the WB, data are representative of 3 independent experiments and values are expressed as mean ± sd; *p < 0.05, **p < 0.01. (G) qPCR analysis of BMP target genes at E16.5 dpc. Values plotted as mean ± SEM; n = 5; *p < 0.05.

