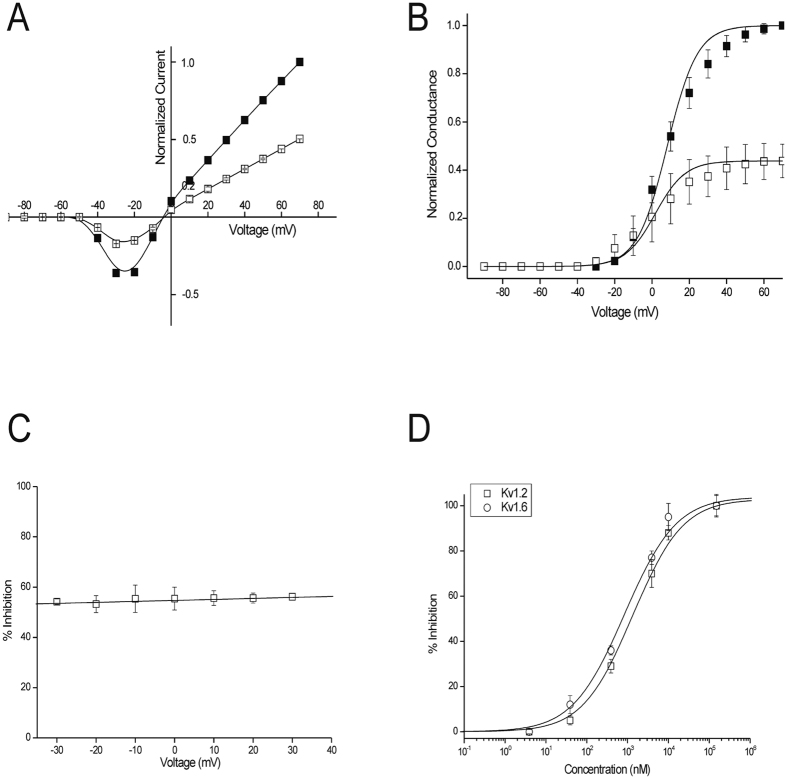
Figure 3. rAtPDF2.3 induces modulation of Kv1.2 channel gating.
(A) Current-voltage relationship in HK. Closed symbols represent control condition, open symbols after application of 2 μM rAtPDF2.3; (B) Conductance-voltage relationship in ND96. Closed symbols represent control conditions, open symbols after application of 2 μM rAtPDF2.3; (C) The percentage of inhibition at a broad range of potentials is shown. No voltage dependence of inhibition was observed; (D) Concentration-response curve on Kv1.2 and Kv1.6 channels obtained by plotting the percentage of blocked current as a function of increasing toxin concentrations.

