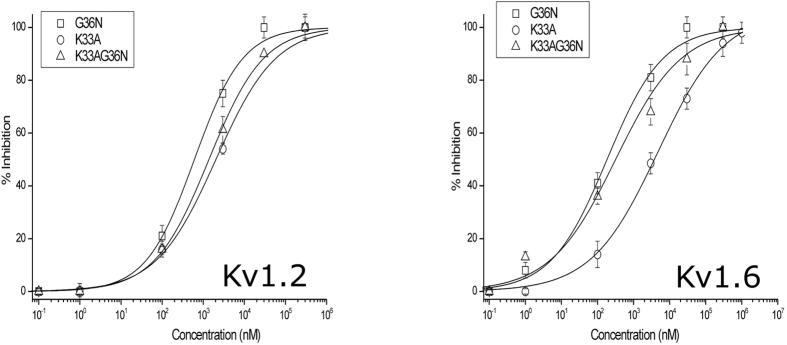
Figure 4. Activity of rAtPDF2.3 variants on Kv1.2 and Kv1.6 channels.
Concentration-response curve on Kv1.2 and Kv1.6 channels obtained by plotting the percentage of blocked current as a function of increasing toxin concentrations. All data represent at least 3 independent experiments (n ≥ 3) and are presented as mean ± standard error. For both Kv1.2 and Kv1.6 channels it can be concluded that the amino acid substitutions K33A and G36N result in a decreased efficacy and in lower IC50 values, respectively.

