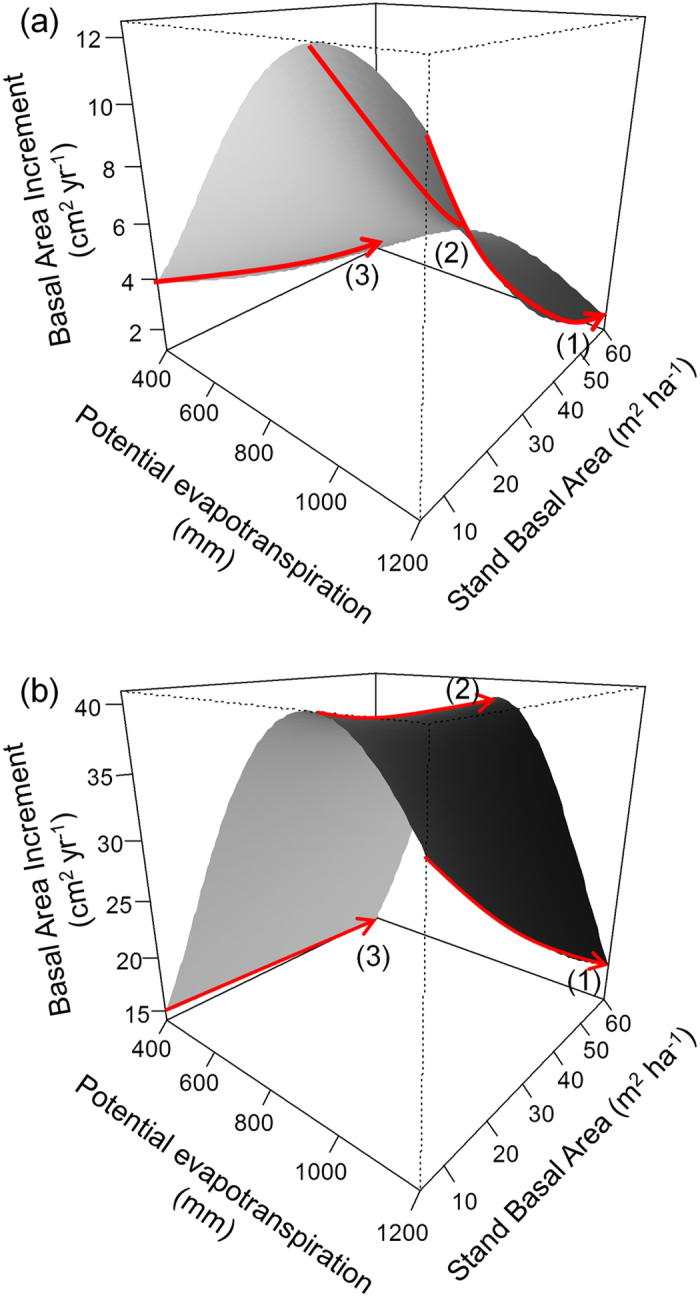
Figure 1. Predicted tree growth as function of potential evapotranspiration and stand basal area keeping size and the proportion of other functional types constant in mean values.

Red arrows indicate the main trends of tree growth at low, intermediate and high PET values.
