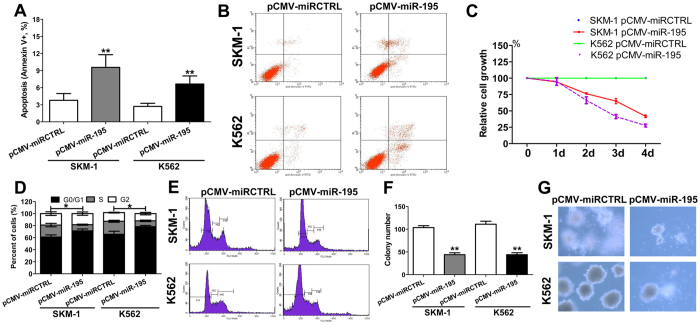
Figure 5. Overexpression of miR-195-5p results in an elevated cell apoptosis and reduced cell growth.
(A) Overexpression of miR-195-5p significantly increased cell apoptosis in SKM-1 and K562 cells; (B) The representative flow graphic for apoptosis detection in the cells transfected with pCMV-miR-195-5p or control vector is shown; (C) Overexpression of miR-195-5p resulted in significant growth inhibition of SKM-1 and K562 cells; (D) Overexpression of miR-195-5p induced an incremental decrease in the percentage of cells in S phase and cell cycle arrest in the G0/G1 phase; (E) The representative flow graphic for cell cycle detection is shown; (F) Overexpression of miR-195-5p significantly decreased colony formation; (G) The representative graphic for colony detection is shown. Error bars throughout represent the s.e.m. *P < 0.05; **P < 0.01 and ***P < 0.001 relative to the pCMV control vector. Throughout the figure, unpaired Student’s t tests were used to calculate all P values. The data shown in the graphics are representative values from three independent experiments.

