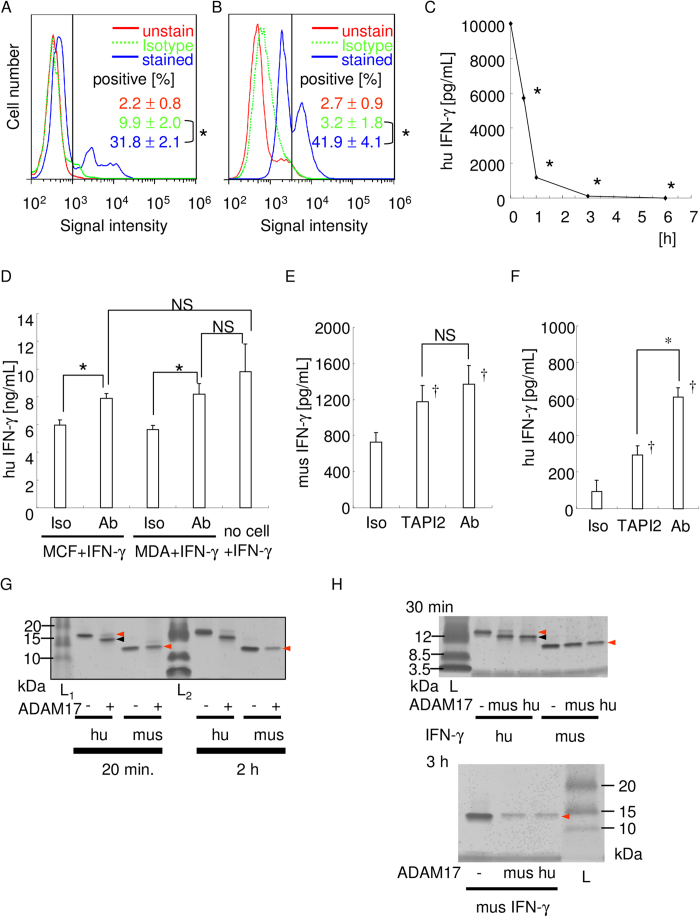
Figure 4. ADAM17-expressing breast cancer cells degrade IFN-γ in an ADAM17-dependent manner.
The expression of ADAM17 by MCF7 (A) and MDA-MB-453 (B) cells were examined by flow cytometry. The red line indicates fluorescence of unstained cells, the dotted green line indicates fluorescence of CF647-conjugated isotype IgG stained cells, and the blue line shows fluorescence of stained cells, respectively. The results are representative of three independent experiments, and the mean percentage of ADAM17-positive cells is also shown. The vertical black line indicates the threshold. *p < 0.05 between the groups. (C) Time-course degradation of IFN-γ by MCF7 cells. IFN-γ concentration at each time point was measured. The representative result of three independent experiments is shown. *p < 0.05 versus 0 h. (D–F) ADAM17 blockade inhibited IFN-γ degradation. by MCF7 and MDA-MB-453 cells at 0.5 h. Recombinant human IFN-γ degradation by MCF7 and MDA-MB-453 cells at 0.5 h were shown (D). Recombinant mouse (E) or human (F) IFN-γ degradation by MCF7 cells at 3 h were shown. In the cell culture, isotype control IgG, anti-ADAM17 neutralizing antibody (100 ng/mL), or TAPI2 (10μM) was applied, respectively. *p < 0.05 between the groups. †p < 0.05 versus isotype control IgG applied sample. NS: no statistically significant difference between the groups. (G) Comparison of ADAM17-mediated degradation of human and mouse IFN-γ. IFN-γ (200 ng) and ADAM17 (100 ng) was incubated for 20 min or 2 h, electrophoresed, and silver staining was performed. Red arrowhead indicates intact band, and the black arrowhead indicates degraded band. (H) Comparison of IFN-γ degradation activity of human and mouse ADAM17. Human or mouse ADAM17 (100 ng) was incubated with human or mouse IFN-γ (200 ng each) for 30 min or 3 h, electrophoresed, and silver staining was performed. Red arrowhead indicates intact band, and the black arrowhead indicates degraded band.

