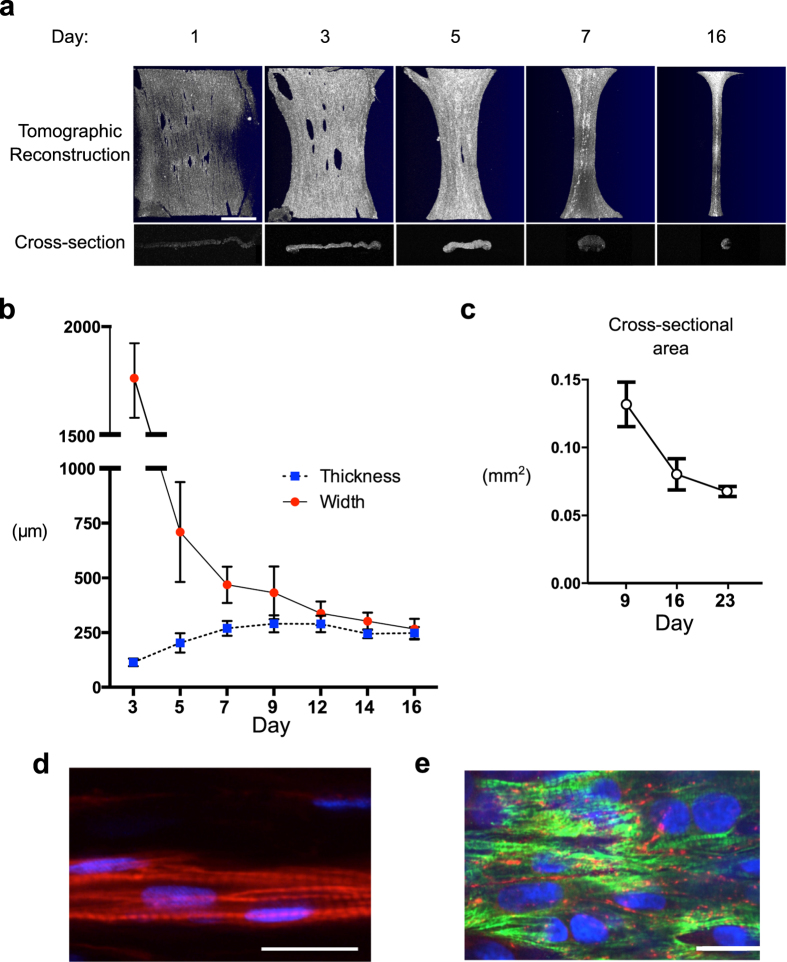
Figure 3. Matrix Remodeling and Histological Evaluation.
(a) Optical coherence tomography (OCT) showing 3D reconstructions of EHTs (first row) formed by stacking serial cross-sectional images (second row) (scale bar, 1 mm). (b) OCT was used to follow EHT thickness and width between 3 and 16 days post-seeding. (c) Mean cross-sectional area assessed in 9-, 16-, and 23-day old EHTs. (d) Fluorescent staining for actin filaments (phalloidin, red) and nuclei (DAPI, blue) show the formation of NRVMs into rod-shaped cells within the scaffold after 16 days of culture. Striations indicate the formation of sarcomeres (scale bar, 25 μm). (e) Staining for cardiac Troponin T (green) and Connexin 43 (red) of an EHT seeded with human embryonic stem cell-derived cardiomyocytes. Note the formation of gap junctions between neighboring cardiomyocytes after 16 days in culture (scale bar, 25 μm).

