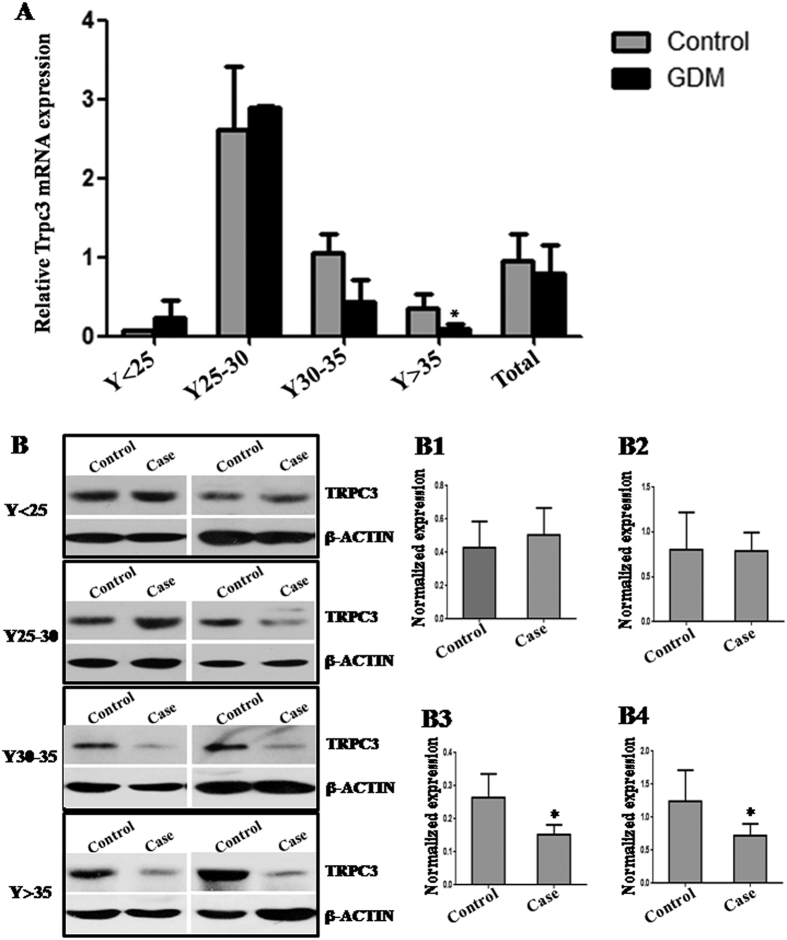
Figure 9. Trpc3 expression in GDM placental tissues.
The Trpc3 expression in the placental tissues from patients with GDM was detected by qRT-PCR (A) and western blot (B). The gray histograms of B1–B4 represent the protein level of MECP2 in placental tissues in Y < 25, Y25~30, Y30~35 and Y > 35 age group, respectively. Gapdh and β-ACTIN serve as an internal reference for qRT-PCR and western blot, respectively. *P < 0.05.

