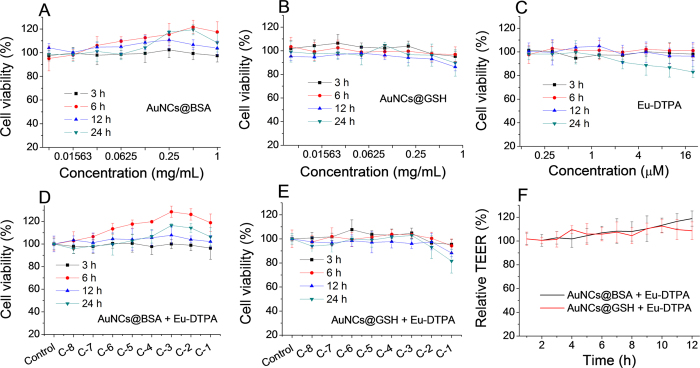
Figure 2. MTS assays of MDCK cells upon treatment with AuNCs and Eu-DTPA.
(A) AuNC@BSA. (B) AuNC@GSH. (C) Eu-DTPA. (D) AuNC@BSA + Eu-DTPA. (E) AuNC@GSH + Eu-DTPA. C-1 denotes combination of 20 μmol/L Eu-DTPA with 1 mg/mL AuNC@BSA or 0.8 mg/mL AuNC@GSH, and C-2∼C-8 denote proportional dilution of C-1. (F) TEER of MDCK cell monolayer after treated with AuNCs and Eu-DTPA combination at C-1 concentration. All data were the mean ± SD of four replicates.

