Figure 1.
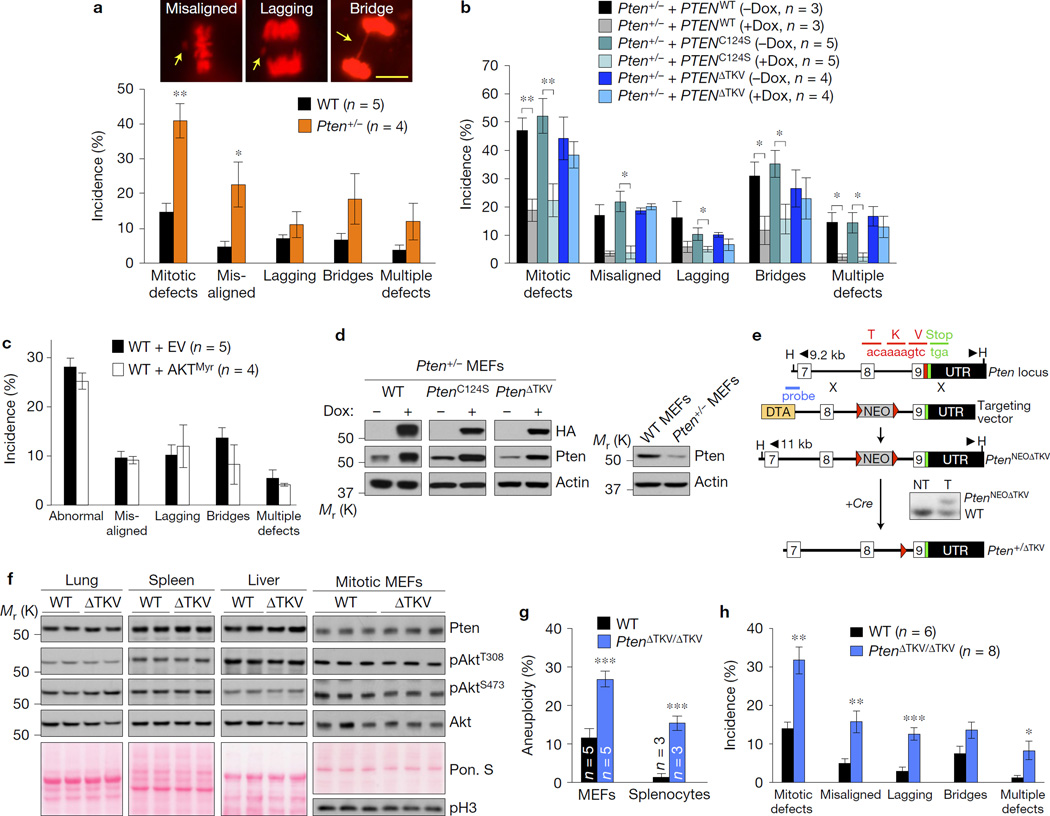
The PDZ-BD of Pten is required for proper chromosome segregation. (a–c) H2B–mRFP-expressing MEF lines monitored for mitotic defects (misaligned chromosomes, lagging chromosomes and chromatin bridges) by live-cell imaging as they progress through mitosis. n, the number of independent MEF lines (18–64 cells per line). Images above the graph in a represent H2B–mRFP-expressing Pten+/− MEFs with the indicated mitotic defects (arrows). Scale bar, 10 µm. (d) Western blots of lysates from WT or Pten+/− MEFs carrying HA-tagged PTEN mutants introduced by the TRIPz (Dox-inducible) lentiviral expression system. (e) Schematic representation of the knock-in gene targeting strategy to generate Pten mutant mice lacking the PDZ-interaction motif TKV. Part of the Pten locus, the targeting vector with loxP (red triangles), HindIII (H) restriction sites, and the Southern probe are indicated. The resulting PtenNEOΔTKV allele in embryonic stem cells was identified by Southern blot analysis. Mice carrying the knock-in allele were crossed with HPRT–Cre transgenic females to generate Pten+/ΔTKV heterozygous offspring. (f) Western blots of lysates from the indicated tissues of WT and PtenΔTKV/ΔTKV (ΔTKV) mice. Ponceau S (Pon. S) staining of blotted proteins served as a loading control, and phospho-histone H3 (pH3) as a control for equal loading of mitotic cells. (g) Karyotype analysis of passage 5 MEFs and splenocytes from 5-month-old mice. n, the number of independent MEF lines or spleens (50 spreads per MEF line or spleen). (h) MEFs monitored for mitotic defects by live-cell imaging. n, the number of independent MEF lines (≥31 cells per line). Values in a–c,h represent mean ± s.e.m., and in g mean ± s.d. Statistical significance in a,g,h was determined by unpaired t-test, and statistical significance in cells transduced with virus in b,c was determined by paired t-test. *P <0.05; **P <0.01, ***P <0.001. Unprocessed original scans of blots can be found in Supplementary Fig. 6 and statistics source data in Supplementary Table 1.

