
Figure 3.
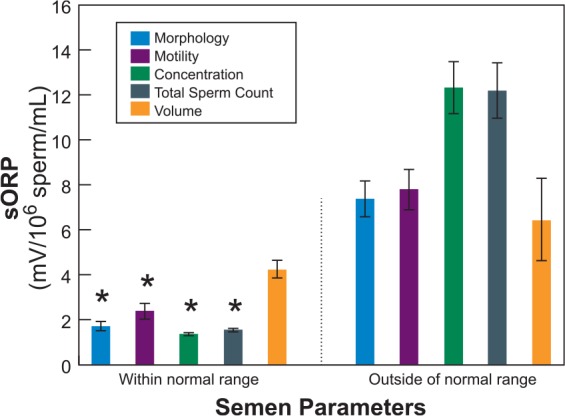
Comparison of sORP (mean ± SEM) measured in semen samples with semen parameters (sperm morphology, motility, concentration, total count and semen volume) within the normal range and those outside according to 2010 WHO criteria.
Total sample size, n = 366: morphology (within range n = 183, outside range n = 183), motility (within range n = 219, outside range n = 147), concentration (within range n = 260, outside range n = 106), total sperm count (within range n = 264, outside range n = 102), volume (within range n = 313, outside range n = 53).
Data analyzed by individual parameter using Student’s t-test.
*Differences were statistically significant at a p < 0.0001.
SEM, standard error of the mean; sORP, static oxidation-reduction potential; WHO, World Health Organization.