
Figure 4.
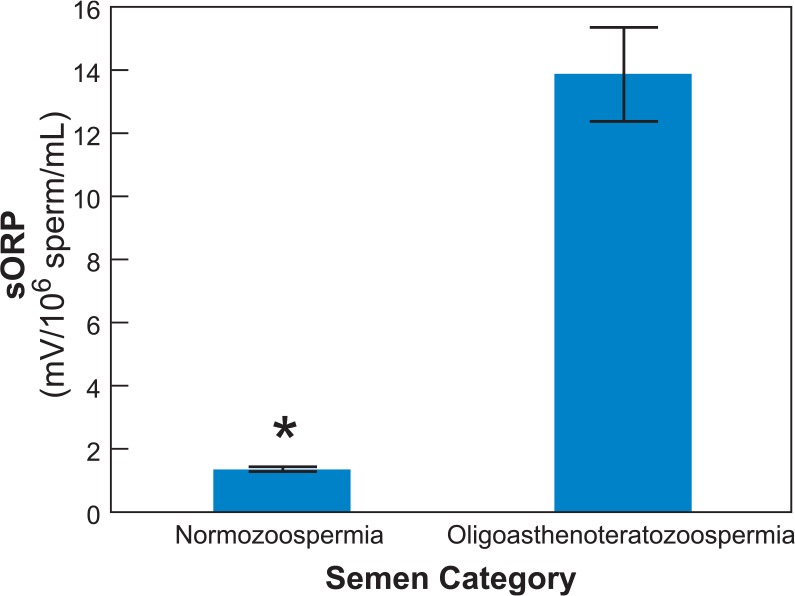
Comparison of sORP (mean ± SEM) in semen samples from normozoospermic and oligoasthenoteratozoospermic men. Normozoospermic semen (n = 149) have significantly lower sORP values than oligoasthenoteratozoospermic semen (n = 69).
Data were analyzed by Student’s t-test.
*Differences were statistically significant at a p < 0.0001.
SEM, standard error of the mean; sORP, static oxidation-reduction potential.