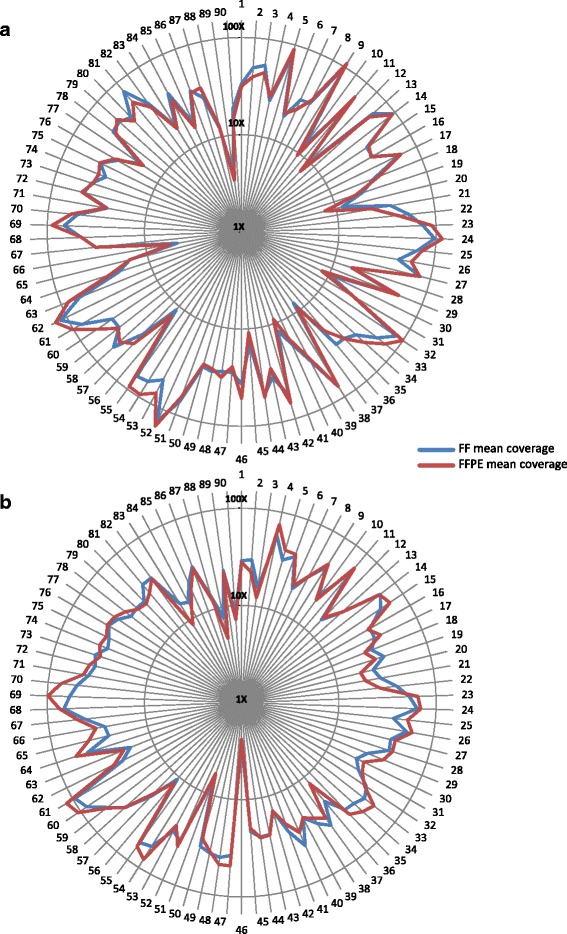
Fig. 5.

Coverage distribution across 90 PCR-capture amplicons between FF and FFPE samples. Coverage distribution across the 90 ‘AmpliSeq Colon and Lung Cancer Panel’ regions displays a similar trend between the FF (blue) and FFPE (red) libraries in both Agilent SureSelect (a) and Roche NimbleGen (b) libraries respectively, with a slightly better coverage in FFPE samples. Each amplicon is identified by a number as reported in Additional file 3: TableS7
