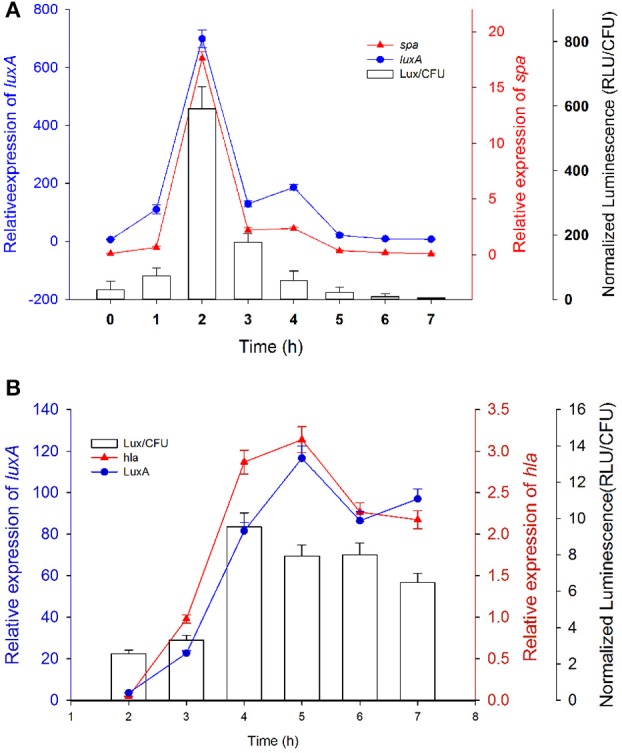
Figure 3.

Correlations between the gene expression monitored by real-time PCR of spa and luxA driven by the spa promoter and the expression of the same promoter monitored by luminescence signal. Bacteria containing plasmid pGL-spa (A) or pGL-hla (B) were cultured with shaking at 37°C and luminescence signals were monitored every 1 h. RNA was extracted at corresponding time point for quantifying the gene expression level by real-time PCR. Bar graph, normalized luminescence signal; Red solid triangle, relative spa/hla expression; Blue solid cycle, relative luxA expression. Experiments were carried out in triplicate and repeated twice. The mean value is shown with s.d.
